Andrew Gillen is a senior policy analyst for the Next Generation Texas initiative at the Texas Public Policy Foundation and an adjunct professor of economics at Johns Hopkins University; [email protected]. Gillen’s recent work has focused on how to reform federal financial aid, how state disinvestment is a myth, and how post-college earnings and debt should be used to inform student choice and government accountability. He served on the U.S. Department of Education’s Advisory Committee on Student Financial Assistance.
Introduction
Although colleges receive funds from student loans, they have largely escaped accountability for their role when students take on unaffordable student loan debt. One partial exception was a set of regulations called “Gainful Employment” that sought to hold some higher education programs accountable for excessive student loan debt. If a targeted program’s students had too much debt relative to their income, the program would lose access to the federal financial aid programs. Gainful Employment is no longer in effect, but some policymakers are considering reviving the regulations.
This study explores the approach used by Gainful Employment to help policymakers develop the next iteration of accountability for higher education. We use new U.S. Department of Education College Scorecard data (U.S. Department of Education, n.d.) and an updated approach called “Gainful Employment Equivalent” to help policymakers envision better accountability mechanisms for higher education by building on Gainful Employment’s successes while avoiding its flaws.
Background on the Gainful Employment Regulations
For students to be eligible for federal financial aid programs like Pell Grants or federal student loans, the Higher Education Act (1965) requires some college programs to “prepare students for gainful employment in a recognized occupation” (Section 1002(b)(1)(A)(i)). However, gainful employment was not defined.
In 2011, the Obama administration made its first attempt at defining gainful employment by releasing a set of Gainful Employment regulations. These regulations sought to terminate federal financial aid for programs where student debt was too high relative to income or where too few students were repaying their loans. But in 2012, the regulations were thrown out by the courts because the repayment rate threshold was “arbitrary and capricious” (Ass'n of Private Colleges & Univs. v. Duncan, 2012, 1).
A revised set of regulations were released in 2014, which survived legal challenge. Under this version of Gainful Employment, programs would be subjected to two debt-to-earnings measures. The details are a bit technical,1 but the general idea was that if an educational program led to excessive student loan debt, then it was by definition not preparing students for gainful employment. While the regulations were established in 2014, it required new data that took the U.S. Department of Education some time to create. As a result, the first Gainful Employment data were released in early 2017.
The Trump administration did not release additional Gainful Employment data and formally rescinded Gainful Employment in 2019, partly because of the selective targeting of for-profit colleges. The Biden administration is considering reviving Gainful Employment.
What Gainful Employment Got Right
Gainful Employment made two excellent improvements to the accountability landscape. For the first time, accountability was applied at the program level rather than the institution level. A program is a college/major/level of degree combination. For example, the bachelor’s degree major (the level) in economics (the major) at the University of Texas-Austin (the college) would be a program. Program-level accountability is vastly superior to institution-level accountability because outcomes can vary dramatically among programs at the same institution, meaning that a broad institutional average on an accountability metric can be quite misleading. Institution-level metrics allow poorly performing programs at “good” colleges to escape accountability while punishing high-performing programs at “bad” colleges. Program level accountability avoids these problems.
The second improvement the Gainful Employment regulations made in the accountability landscape was the first attempt to include students’ post-graduation earnings in an accountability metric. Earnings were evaluated relative to student loan debt, and programs that left their students with excessive student loan debt relative to students’ earnings could have their eligibility for financial aid programs terminated.
Both features were improvements over the standard approach to accountability in higher education, which is done at the institutional level and ignores earnings outcomes. These features should be incorporated into future accountability systems.
What Gainful Employment Got Wrong
However, Gainful Employment did have a fatal downside. The Obama administration ensured that Gainful Employment was applied selectively, almost exclusively targeting for-profit colleges.2 Claiming to apply the regulations to all “vocational” programs, they then classified all programs offered by a for-profit college as vocational while not a single degree-granting program at a public or private nonprofit college was considered vocational.
As a matter of logic, this categorization failed miserably. A bachelor’s in nursing program at a for-profit college was subject to the Gainful Employment regulations, while a bachelor’s in nursing program at a public college was not. Similarly, a master’s in social work program at a for-profit college was considered vocational, but a master’s in business administration (MBA) program at a public college was not. An MBA program is perhaps the clearest possible example of a vocational program, yet as long as the MBA program was housed at a public or private nonprofit college, it would not be considered vocational and would therefore not be subject to Gainful Employment.
While logically challenged, this scheme worked as designed to selectively target for-profit colleges, where 97.9 percent of failing programs were located. (The remaining programs were certificate programs at public and private nonprofit colleges, the only programs at public or private nonprofit colleges that were classified as vocational.)
The ideological bias of Gainful Employment’s selective targeting of for-profits can be seen clearly in Figures 1 and 2, which use the Debt as Percent of Earnings metric the Texas Public Policy Foundation created to determine which programs leave their students with excessive student loan debt.3 Debt as a Percent of Earnings is the median student loan debt as a percent of median earnings for a program’s graduates. For example, a program with median earnings of $50,000 and median debt of $25,000 would have a Debt as a Percent of Earnings value of 50 percent. If debt increased to $50,000, their Debt as a Percent of Earnings value would increase to 100 percent. Thus, the lower the value, the better for students.
Figure 1 is a histogram of college bachelor’s degree programs by debt as a percent of earnings, with different shades for different types of colleges (public, private nonprofit, and private for-profit). For-profit programs represent a small portion of programs at every level of debt as percent of earnings, including values above 100 percent, which is generally considered a red flag.
Figure 1
Distribution of Debt as a Percent of Earnings by Control: Bachelor’s Degree
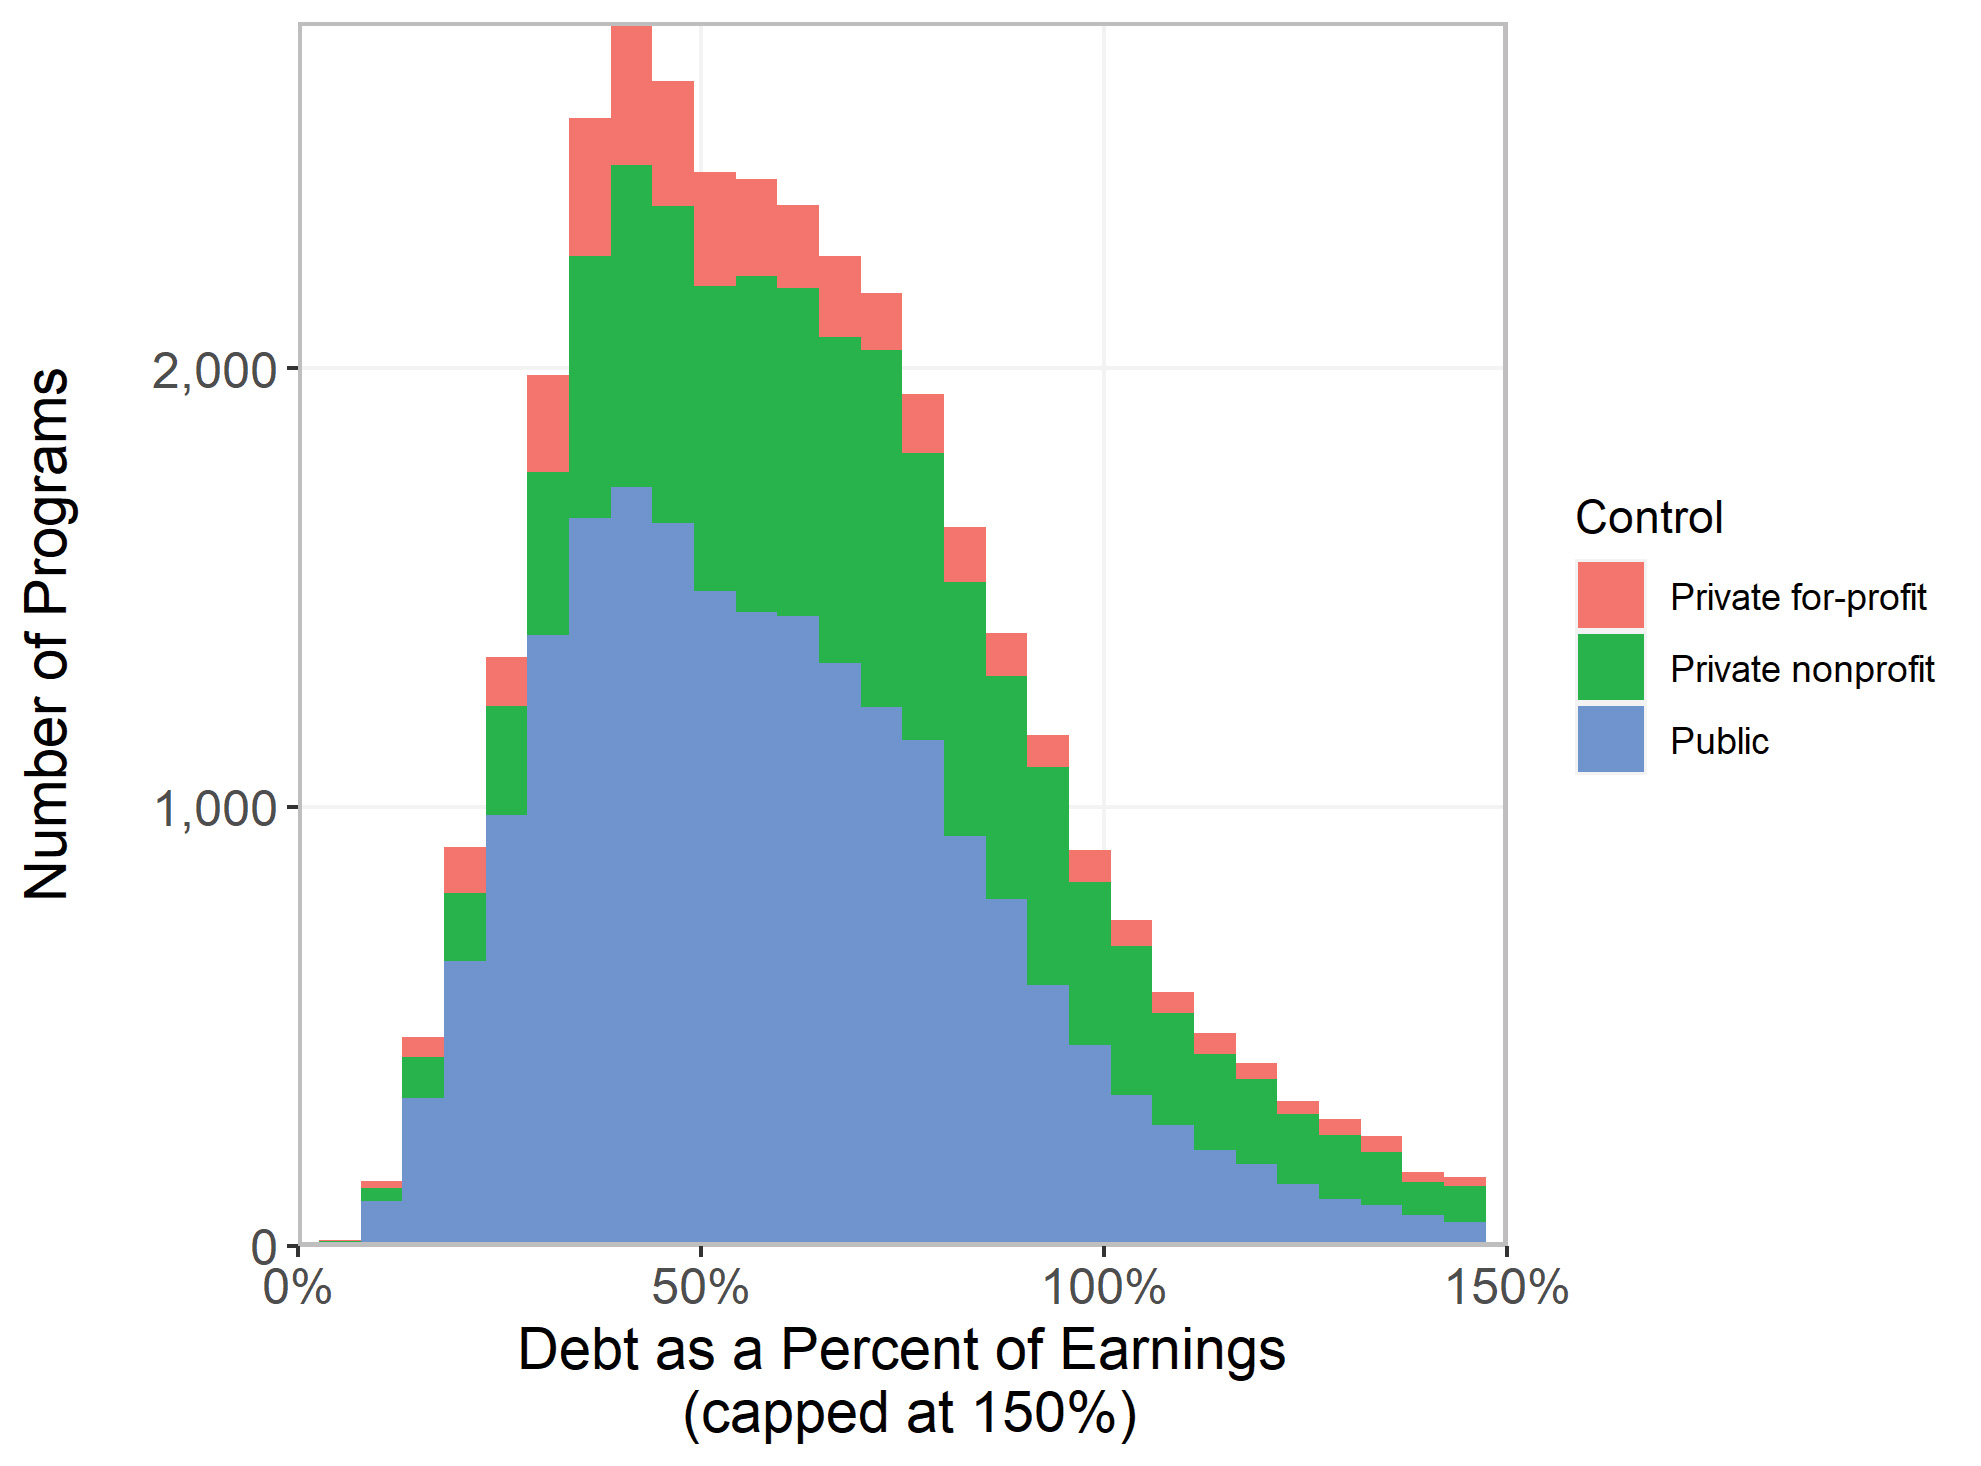
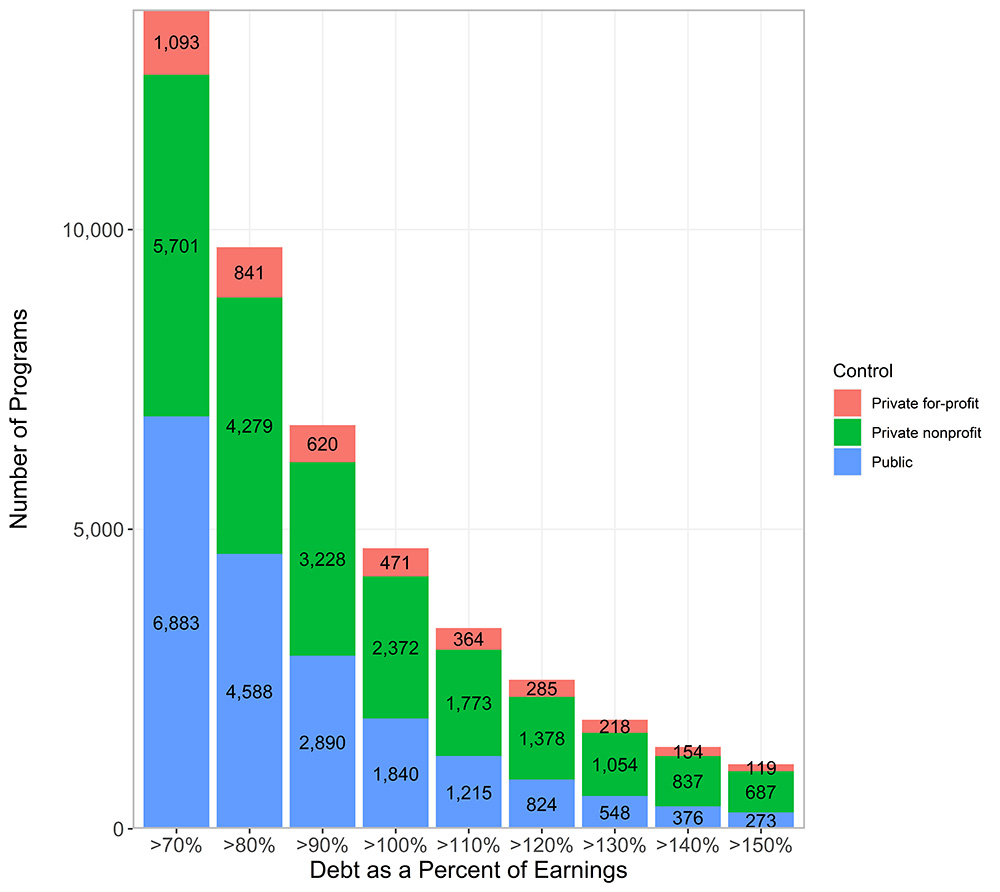
Figure 2 shows the number of programs that exceed a set value of Debt as a Percent of Earnings by control. Consider the set of programs that exceed a Debt as a Percent of Earnings threshold of 100 percent. There are 471 such programs at for-profit universities. These are programs where students likely graduate with excessive student loan debt given their career prospects. But there are another 2,372 such programs at private nonprofit colleges and another 1,840 such programs at public colleges. There is no legitimate reason for policymakers to focus only on the 471 programs at for-profit colleges while ignoring the same problem at 4,212 public and private nonprofit programs.
Figure 2
Number of Programs with Debt as a Percent of Earnings Above Various Thresholds
Gainful Employment Equivalent
While Debt as a Percent of Earnings would be an excellent accountability metric, Gainful Employment used a slightly different approach that focuses on annual debt service payments rather than the student’s overall debt. So, what affect would Gainful Employment (GE) have if it were applied today? To answer that question, we created what we call Gainful Employment Equivalent (GEE). GEE mimics the original GE regulations with two adjustments. First, the cutoffs are updated so that they can be applied to the new data from the U.S. Department of Education’s College Scorecard, which measures debt and earnings differently than GE did (see Appendix A for details on these adjustments). The GEE thresholds are set so that programs that failed GE are highly likely to fail GEE, and programs that passed GE are highly likely to pass GEE. Second, we apply GEE to all higher education programs.
Thus, Gainful Employment Equivalent essentially asks, what would the Gainful Employment regulations look like if they used the most recent data and applied them to all of higher education?
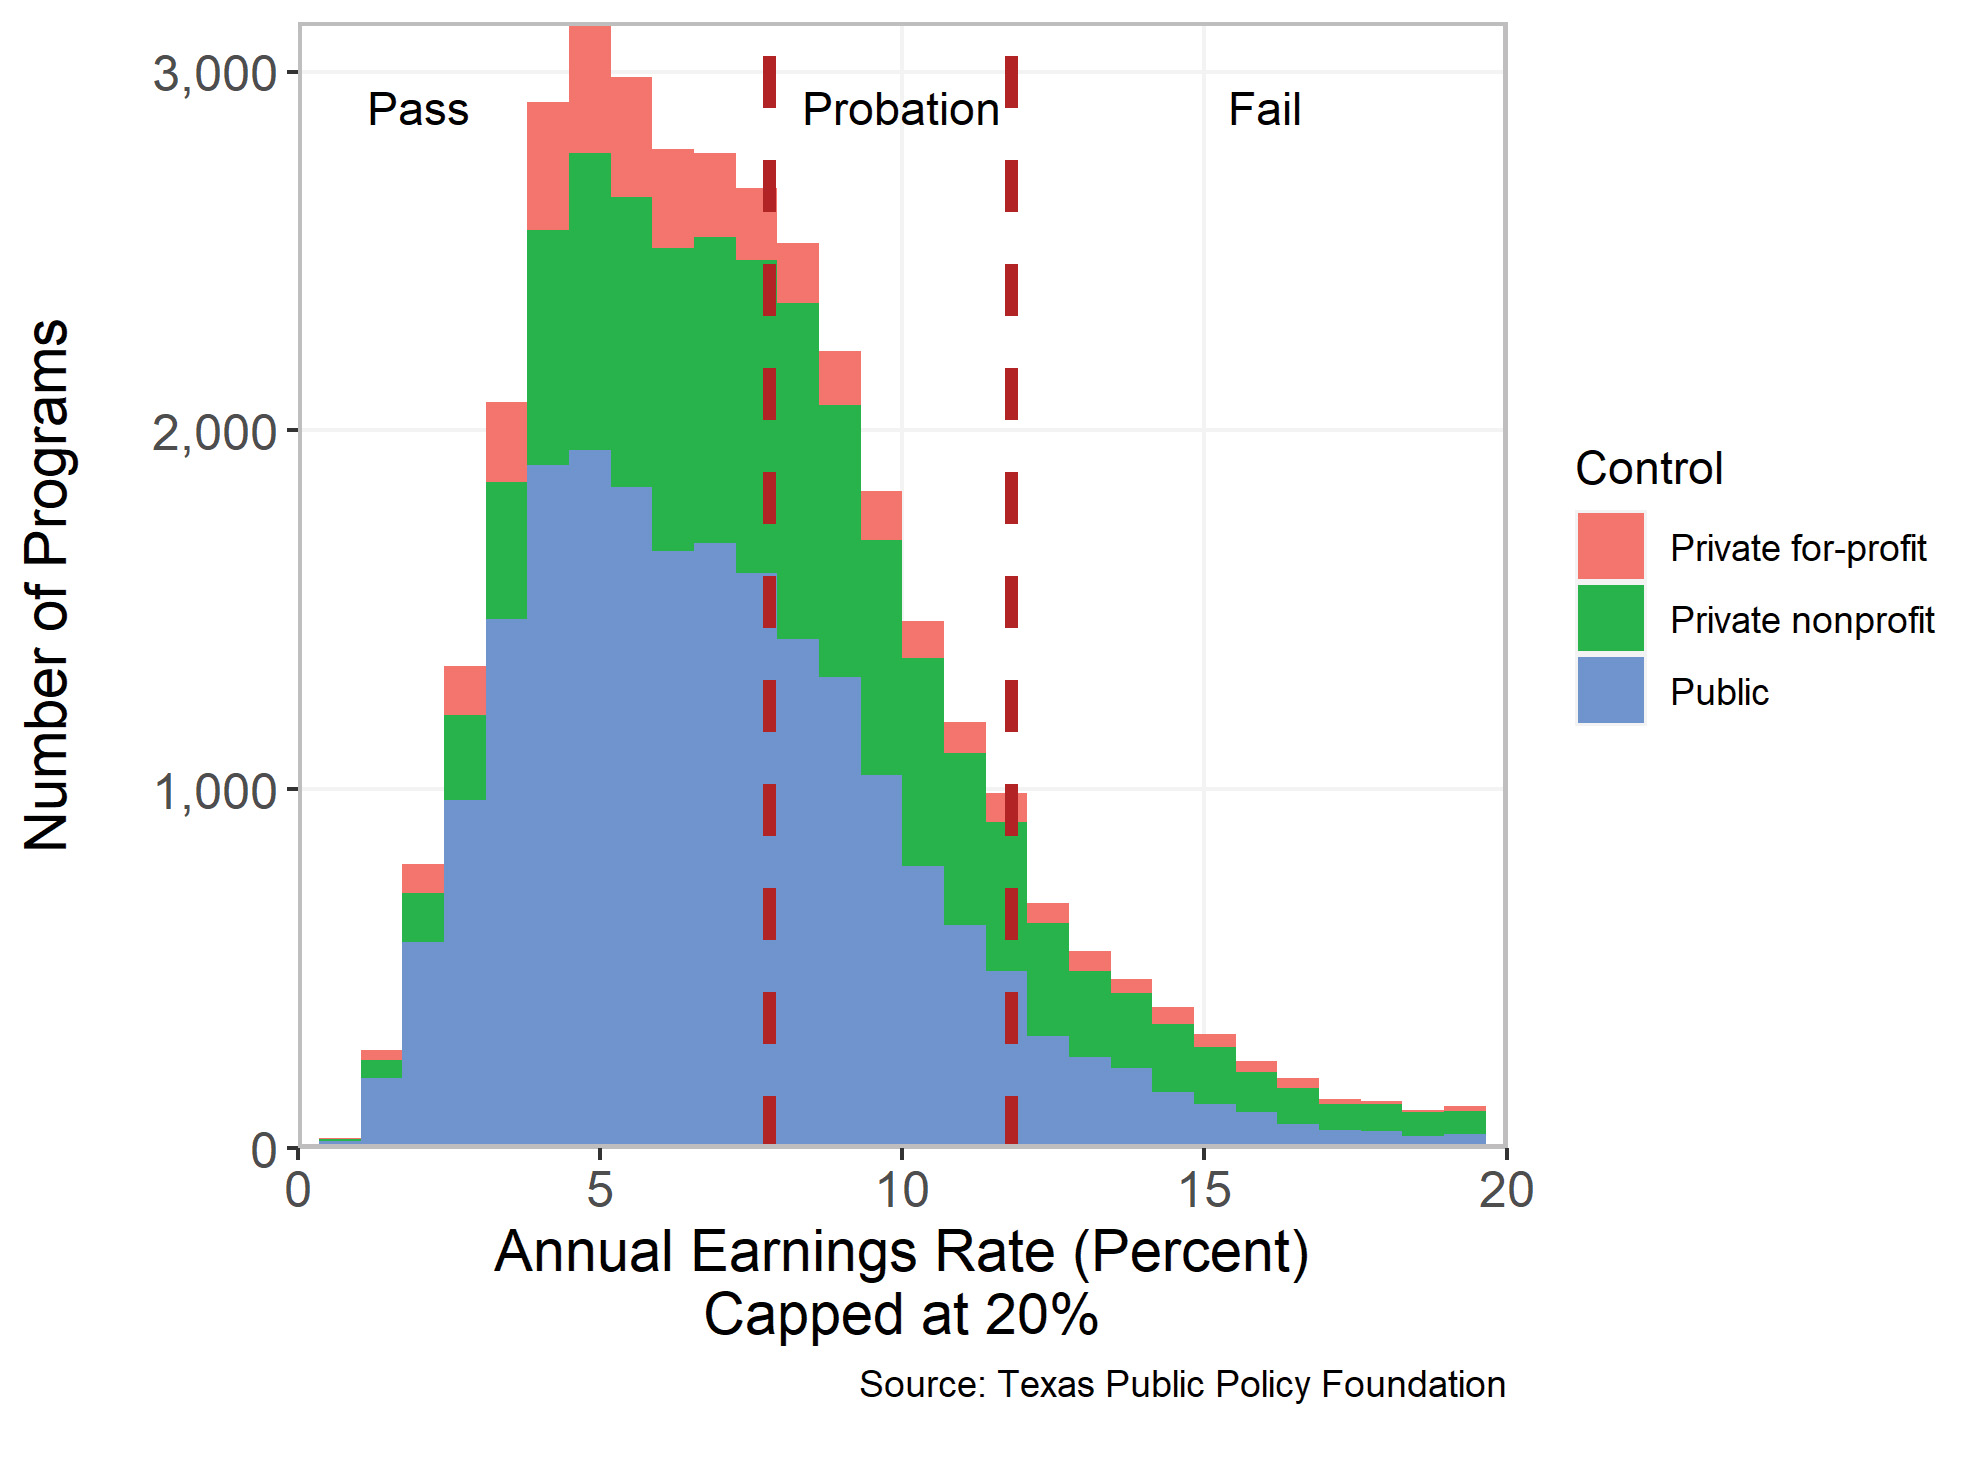
GE and GEE apply two tests, one called the Annual Earnings Rate (AER) and the other the Discretionary Income Rate (DIR), which compare the annual debt payments with annual earnings. Consider the results from the AER test, which is annual debt payments divided by earnings. If annual debt payments were $1,000 and earnings were $25,000, the AER would be 4 percent. A lower value is better. Figure 3 shows a histogram of AER values for college programs by control of the university and again demonstrates that failing programs are not confined to for-profit colleges. (The results are similar for the other GEE test, the DIR).
Figure 3
Gainful Employment Equivalent AER Test Results
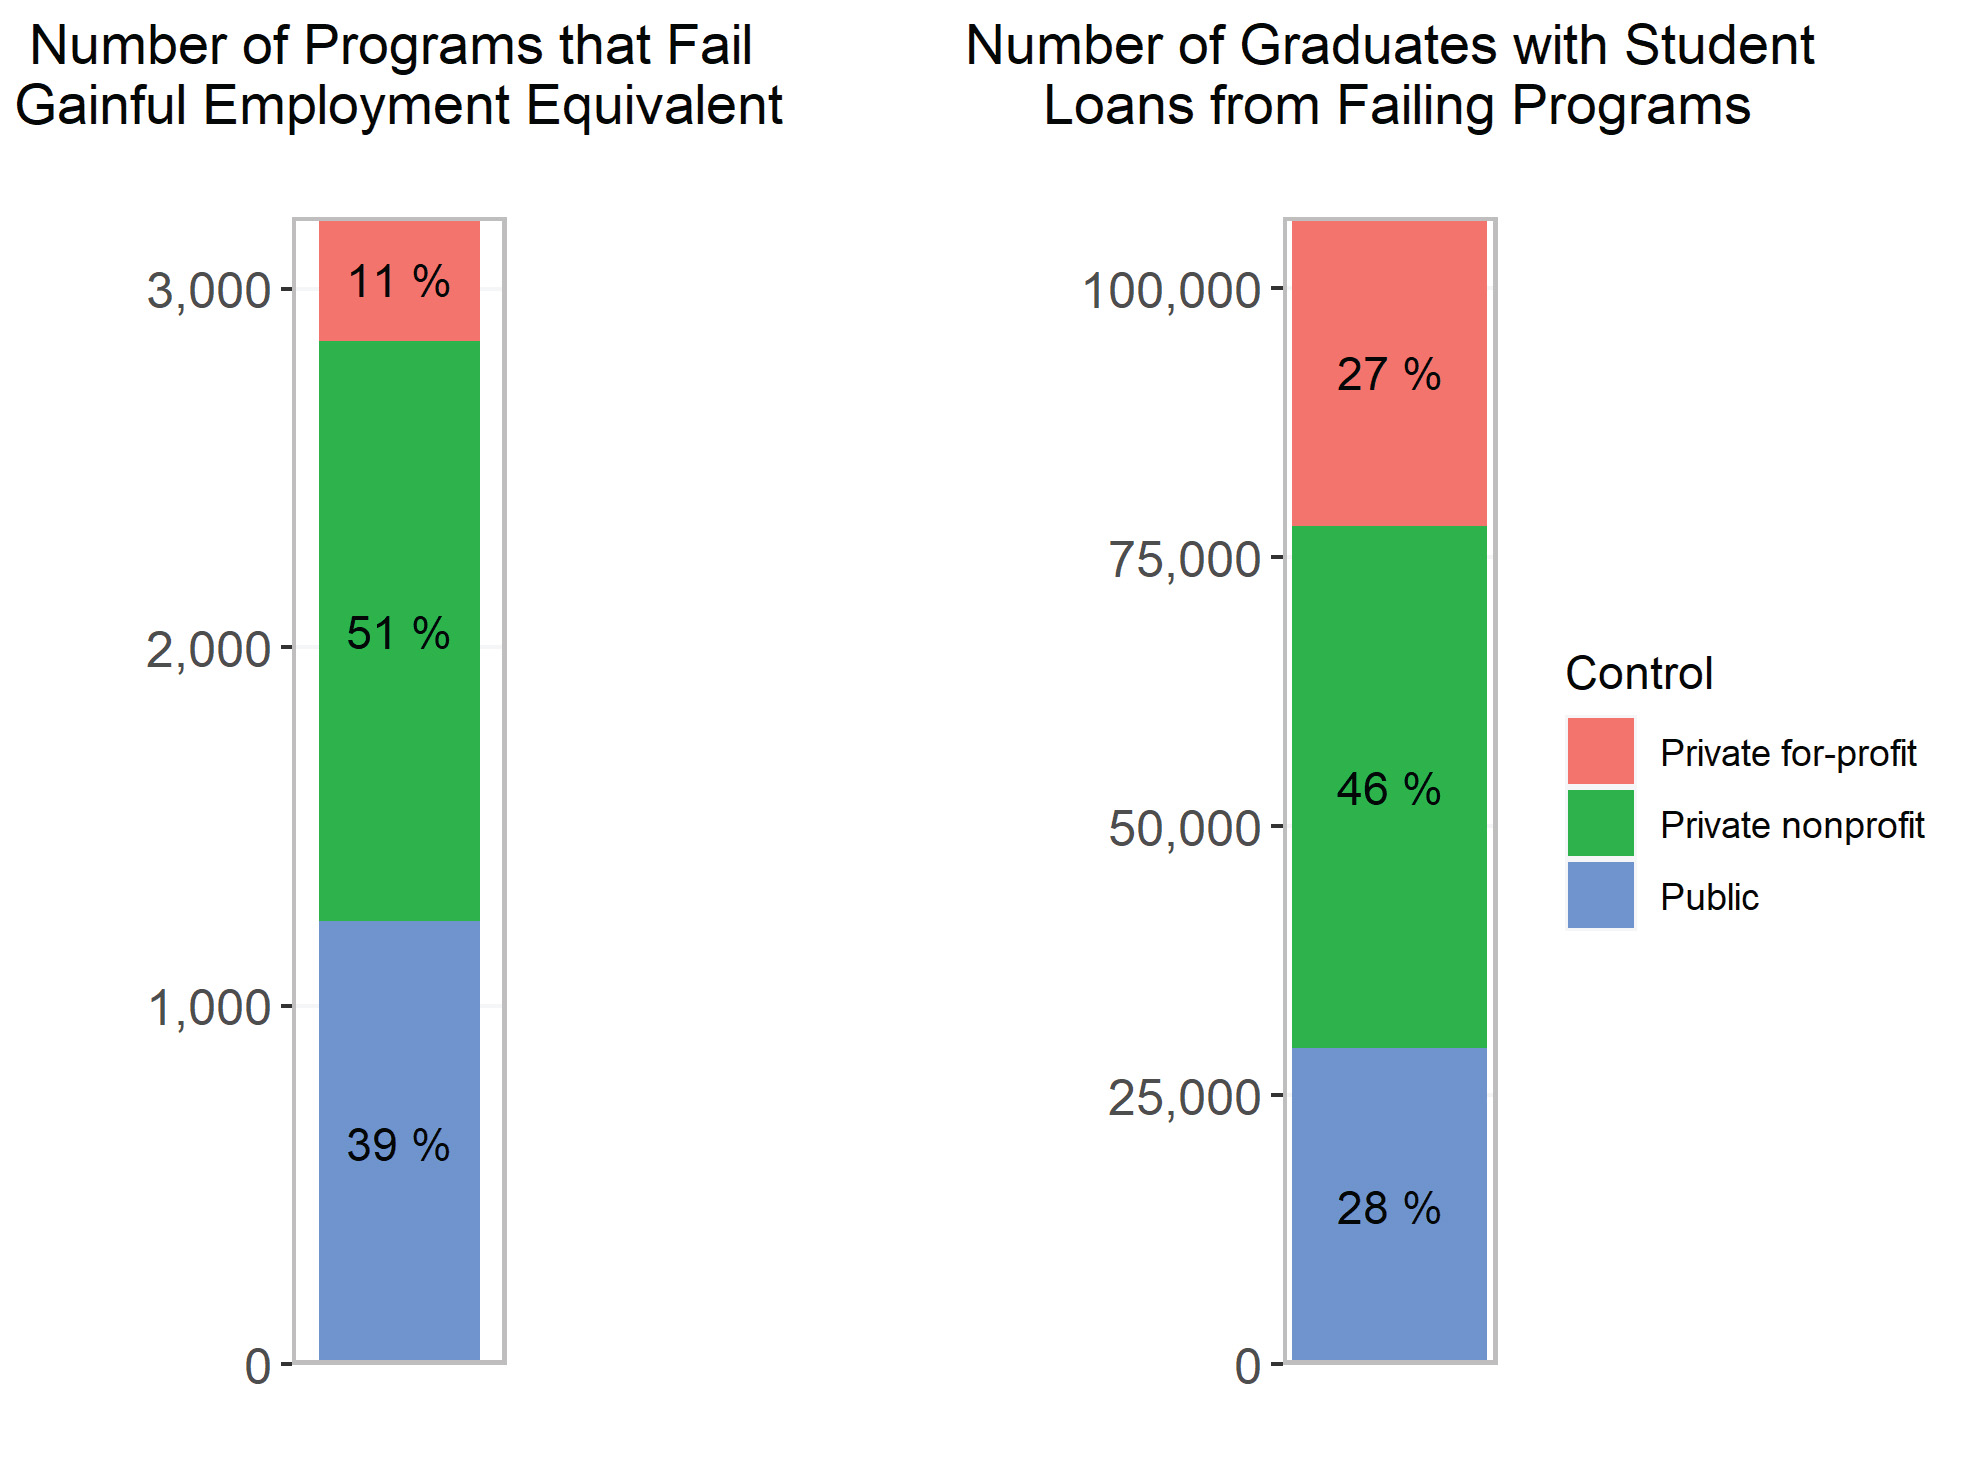
Subjecting all higher education programs with sufficient data to the Gainful Employment Equivalent tests reveals that failing programs are found in all sectors of higher education. Figure 4 shows the number of programs that failed Gainful Employment Equivalent and the annual number of graduates with any student loans from those programs. A total of 3,201 programs fail Gainful Employment Equivalent. These programs graduate over 106,000 students with loans annually, many of whom will never be able to repay their loans. For-profit programs account for 11 percent of these failing programs (345) and 27 percent of graduates (29,000). Both public and private nonprofit programs account for a greater share of failing programs and a greater share of graduates who borrowed.
Figure 4
The Number of Programs that Fail Gainful Employment Equivalent and the Number of Graduates with Loans Graduating from Those Programs
Conclusion
Federal and state policymakers should hold programs accountable for their role in excessive student loan debt. The most important federal attempt to do so is known as the Gainful Employment regulations. Gainful Employment pioneered two improvements to the accountability landscape that should be used in future accountability approaches: focusing on program-level rather than institution-level accountability and including labor market outcomes such as earnings.
But policymakers should also avoid repeating Gainful Employment’s mistakes. Gainful Employment was only selectively applied, targeting for-profit colleges almost exclusively. Yet if Gainful Employment were applied today and restricted to for-profit colleges, it would miss 89 percent of failing programs and 73 percent of student borrowers graduating from failing programs.
Appendix A: Constructing Gainful Employment Equivalent
The AER and DIR formulas can be largely replicated and applied to the new College Scorecard (CS) data. However, the performance thresholds should arguably be updated to account for differences in the GE and the new CS data. The main differences are:
- Program definition—GE used 6-digit CIP codes, whereas CS uses 4-digit CIP codes.
- Debt—GE median debt calculation included student loan debt (for all aid recipients, not just borrowers) and included any private student loans that a college was aware of. CS median debt calculation only includes borrowers and does not include any private debt.
- Earnings—GE earnings included those not working and were measured three to six years after graduation. CS earnings exclude those not working and are measured two years after graduation.
Due to these differences, we updated the performance thresholds used to determine a program’s rating. We found programs that appeared in both the GE and the CS data, calculated their AER based on the CS data, and used regression analysis to determine the correlation between their GE AER values and CS AER values. The regression indicated that CS AER values were about 98 percent of the GE AER value. This implies that the thresholds used in Gainful Employment Equivalent should be 98 percent of thresholds used in the original Gainful Employment. Table A1 reports these values.
Table A1
Gainful Employment Equivalent Cutoffs
|
Pass |
Probation |
Fail |
|
|---|---|---|---|
|
Original Gainful Employment Cutoffs |
AER <= 8 DIR <= 20 |
8 < AER <= 12 20 < DIR <= 30 |
AER > 12 DIR > 30 |
|
Regression-Adjusted Gainful Employment Equivalent Cutoffs |
AER <= 7.8 DIR <= 19.6 |
7.8 < AER <= 11.8 19.6 < DIR <= 29.4 |
AER > 11.8 DIR > 29.4 |
1 The Annual Earnings Rate (AER) test was based on annual debt payments as a percent of earnings, and the Discretionary Income Rate (DIR) test was based on annual debt payments as a percent of earnings minus 150 percent of the poverty line. An AER less than 8 percent or a DIR less than 20 percent was considered passing, while an AER greater than 12 percent or a DIR greater than 30 percent was considered failing, with the intermediate range being a probationary area.
2 Andrew Gillen, Richard Vedder, “Obama did persecute for-profit colleges,” Wall Street Journal, February 25, 2020.
3 Andrew Gillen, College Student Loan Debt and Earnings: 2021, Texas Public Policy Foundation, forthcoming 2021.
Photo by the blowup on Unsplash