Research since World War II has consistently found overwhelmingly left-oriented political attitudes and ideological self-Identification among college and university faculty. It has also found overwhelming support for the Democratic Party (see e.g., Klein and Stern, 2005; Klein and Stern, 2009; Gross & Simmons, 2007; Honeycutt & Freberg, 2017; McClintock, Spaulding, & Turner, 1965; Rothman, Lichter, & Nevitte, 2005; Buss & von Hippel, 2018). These findings are important for several reasons. Researchers have raised concerns that ideological homogeneity may lead to questionable research practices (Duarte, Crawford, Stern, Haidt, Jussim, & Tetlock, 2015; Jussim, Crawford, Anglin, Stevens, & Duarte, 2016; Martin, 2015; Stevens, Jussim, Anglin, & Honeycutt, 2019; Yancey, 2011). This concern is grounded in research on confirmation bias, group polarization, motivated reasoning, and the tendency for these phenomena to be even more pronounced among the highly educated. As well, partisan polarization has been leading to Republicans’ increasing skepticism about higher education (Parker, 2019).
Research on the politics of the professoriate has either surveyed individual professors about their partisan or ideological sympathies or identified partisan affiliation by using publicly available voter registration records (Langbert, Quain, & Klein, 2016; Langbert, 2018). At least four consistent findings have emerged from this work: First, although the ratio of faculty who identify as or are registered as Democratic versus Republican (henceforth the D:R registration ratio) varies across departments, it almost always favors the Democratic Party. Second, the D:R registration ratio is typically higher among disciplines in the humanities and social sciences compared to those in the natural sciences and engineering. Third, the D:R registration ratio has increased over time, from roughly 4.5:1 in 1999 (Rothman et al, 2005) to 10:1 among elite liberal arts colleges and social science departments now (Langbert et al, 2016; Langbert, 2018). Fourth, the partisan slant is most extreme in the most highly rated institutions.
Threats to Validity
There are criticisms of use of the D:R registration ratio for illumination of political affiliation or ideological commitment. A good number of professors are not registered as a member of either major political party (Langbert et al, 2016; Langbert, 2018), and many professors are not registered to vote. Registration data is unavailable for professors who are not citizens, who are based in non-US universities, or who are registered in 20 states that do not collect registration data or do not make the data publicly available. As well, identification of registrants relies on personal names, which introduces error because multiple individuals in a state often have the same name. Thus, identification must be done with care, using middle initials, year of college graduation to estimate age, and proximity of the individual’s address to the institution. Naturally, such a process introduces a small and unknown level of error.
Once identified, the meaning of D:R ratios is imprecise because there is ideological variation among the voters within each party, particularly among Democrats, although variation between the parties and homogeneity within the parties have become more pronounced in recent years (Saad, 2017). Moreover, although partisan registration is indicative of a behavior--at one point the person acted and registered as a member of a political party--it provides no guarantee of continued support of a particular party. As examples of this last point, consider both the Reagan Democrats and the Obama-Trump voters.
Naturally, there are also threats to the validity of survey or self-report data. A standard anecdote in research methods and statistics classes is the 1948 opinion polls that mistakenly predicted that Thomas Dewey would defeat Harry S. Truman in the presidential election because the polls relied on telephone surveys, which skewed their findings. After 68 years of experience with surveys and self-report data, polling in the 2016 presidential election ignored threats to validity and failed to predict the election of Donald J. Trump.
In addition, self-report survey data from college professors may suffer from referent error, whereby professors who are in left-dominated environments skew their perceptions of the center leftward. It may also suffer from virtue signaling and self-censorship. Objective data like voter registration and contribution data avoid referent error and conformity pressure, but they are less likely than survey data to capture values, attitudes, and ideologies.
Oliphant (2019) finds that in the general American population 46 percent of Democrats describe their views as liberal; 39 percent of Democrats describe their views as moderate; and 14 percent describe their views as conservative. Saad (2019) finds that 51 percent of Democrats are liberal while 4 percent of Republicans are. In addition, Saad finds that 73 percent of Republicans identify as conservative. Laloggia (2019) finds that while 40 percent of Americans identify as independents, the majority of independents lean toward one of the two parties. That is, 13 percent of voters are independents who lean Republican while 17 percent of voters are independents who lean Democratic. Thus, while party affiliation imperfectly correlates with political ideology or values, the correlation is significant, and the increasing prevalence of independents is probably less important than it seems.
Another advantage to objective measures of party affiliation is that they capture sources of behavior beyond ideology and values. Commitment to a party may be important for instrumental, coalition-building, and lobbying reasons as fleshed out in the public choice literature (Downs, 1957; Olson, 1965; Olson, 1982; Buchanan and Tullock, 1962; Tandberg, 2010) even when broad ideological commitment is lacking.
Triangulation with FEC Data
In this paper we triangulate earlier findings about faculty voter registration (Langbert, Quain and Klein, 2016; Langbert, 2018) by using, along with voter registration, the partisan affiliation of federal contributions listed in the Federal Elections Commission (FEC, 2019) database. Since a large share of academics are either not registered or unaffiliated with a party, an independent measure such as federal contributions can verify, at least roughly, both professors’ partisan affiliations and the political cultures in academic institutions and fields. Federal contributions can be used as indicia as to whether the professors not registered or registered as independents are different from those registered. Thus, the two objective measures, registration and federal contributions, can be used to triangulate or cross-check findings.
FEC data have the advantage that employer information is often, but not always, available for contributors, and that serves as a check on misidentification. Nevertheless, like voter registration, rates of federal contributions available on the FEC website are imperfect measures. Reliance on personal names, which can be spelled in different ways, is a threat to validity. Also, workplaces can be misidentified or not identified in the FEC data.
Although college professors contribute at greater rates than the general population at large, fewer than twenty percent are contributors. Federal contributions are income elastic (Hughes, 2017), so institutional characteristics interact with professors’ fields and individual characteristics. That is, professors in small, religious, and less prestigious institutions are less likely to contribute to candidates and committees in part because they are paid less. During the 2016 cycle, Democrats in the general population were more than twice as likely as Republicans to contribute (22 percent versus 10 percent; Pew, 2017), so contributions after 2012 are likely to skew findings further than the registration data do.
Moreover, it seems likely that the use of the contribution metric tends to be indicative of stronger effective engagement than registration alone. Hughes (2017) finds that 28 percent of Americans who say that they are engaged with politics most of the time report donating while only 7 percent of Americans who say that they are engaged with politics some of the time or less often do so. Professors have little reason to believe that their contributions will alter candidates' votes on education issues, and few expect a quid pro quo for contributions that rarely exceed $1,000; rather than being instrumental, professors’ contributions are likely an expression of belief, affect, or political fashion (Caplan, 2007), and those who believe most strongly are most likely to contribute.
Method
We make use of publicly available voter registration information compiled by Voter Lists Online’s (2019) Aristotle database to measure the D:R registration ratio among 12,372 tenured and tenure-track professors in eight academic departments (anthropology-sociology, biology, chemistry, economics, English, mathematics, philosophy, and psychology). Three of these academic departments are considered natural science (biology, chemistry, and mathematics); four are considered social sciences (anthropology, economics, psychology, and sociology); two are considered humanities (English and philosophy). We had originally planned to include anthropology rather than sociology, but in many colleges the two are combined in one department, so we included both disciplines when they were combined in departments or when a sociology department doubled as an anthropology department. We identified professors associated with each discipline.
We selected the two US News highest-ranked private and two US News highest-ranked public institutions among the national universities, regional universities, and liberal arts colleges in each state. This enabled us to detect differences across regions and across kinds of institutions. We limited the sample of professors to approximately 20 per department, and we limited the sample to professors who hold Ph.D.s.
Having identified their political affiliations, if any, we looked up each professor in the FEC database to determine the political contributions, if any, these professors had made in the past two United States federal election cycles (2015-16 and 2017-18). The data were compiled by several paid research assistants and the lead author, who checked the work of the research assistants.
D:R Registration Ratio
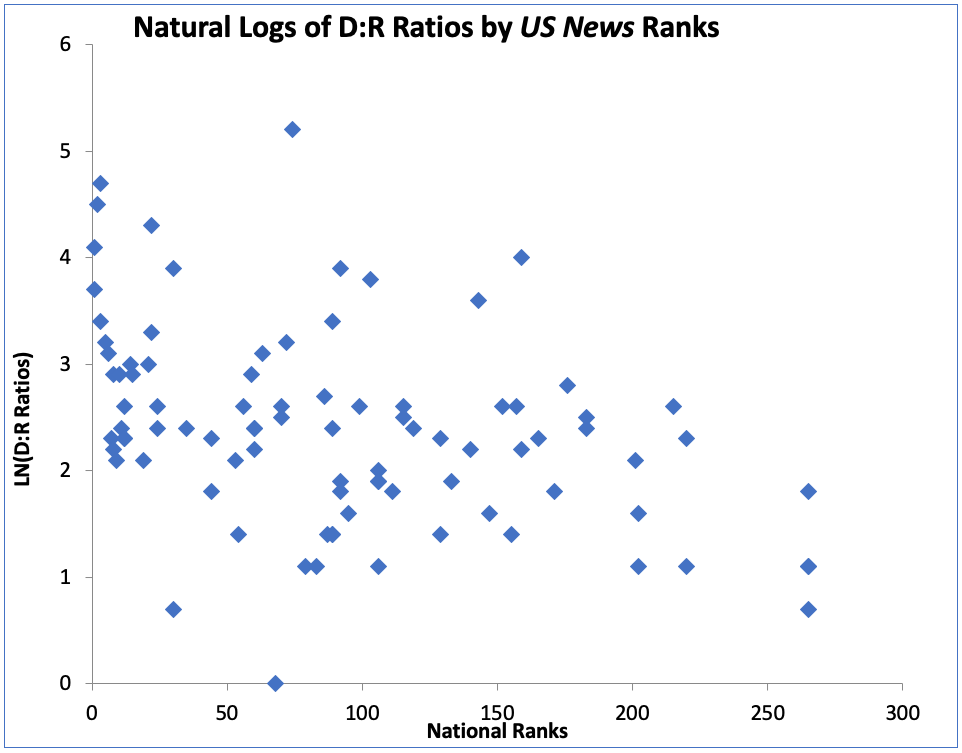
Of the 12,372 professors sampled, 48.4 percent are registered Democrats and 5.7 percent are registered Republicans, a ratio of 8.5:1. In 2016 Gallup (Jones, 2016) finds that for the general population, 29 percent are Democrats and 26 percent are Republicans, a ratio of 1.1:1. The 8.5:1 ratio is lower than previous findings, such as Langbert, et al. (2016) and Langbert (2018), which found 10:1 to 12:1 because those studies looked at the highest-ranked institutions, in which partisan affiliation is the most skewed. The institutions in this study are the most elite in each state, but they are not in all cases the most elite nationally.
The correlation between the ranks of the 90 nationally ranked institutions in the sample and the natural logs of the D:R ratios is -.4. Since the sample is limited to the four leading institutions in 30 states and the District of Columbia, the relationship is probably weaker than it is in the universe of institutions (see Figure 1):
D:R Registration Ratios by Discipline
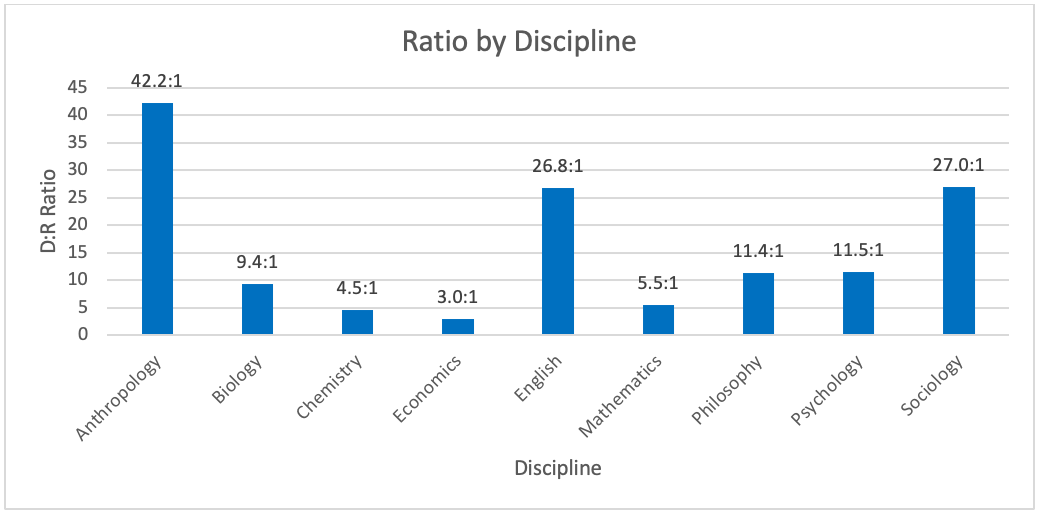
In all nine disciplines, the D:R registration ratio favors the Democratic Party (see Figure 2). Broadly, the natural sciences are the least politically homogenous, with the D:R registration ratio ranging from 4.6:1 (chemistry) to 9.4:1 (Biology). In the social sciences, the D:R registration ratio varies to a much greater extent. Economics has the smallest D:R registration ratio at 3:1 among all nine disciplines, while anthropology has the largest at 42.2:1. With the exception of economics, none of the social sciences have a lower D:R registration ratio than any of the natural sciences. Within the humanities, the D:R registration ratio in English (26.8:1) was more than double the D:R registration ratio in philosophy (11.4:1). In fact, the D:R registration ratio in English is almost identical to the D:R registration ratio in sociology (27:1). This is also the case for philosophy and psychology (11.5:1).
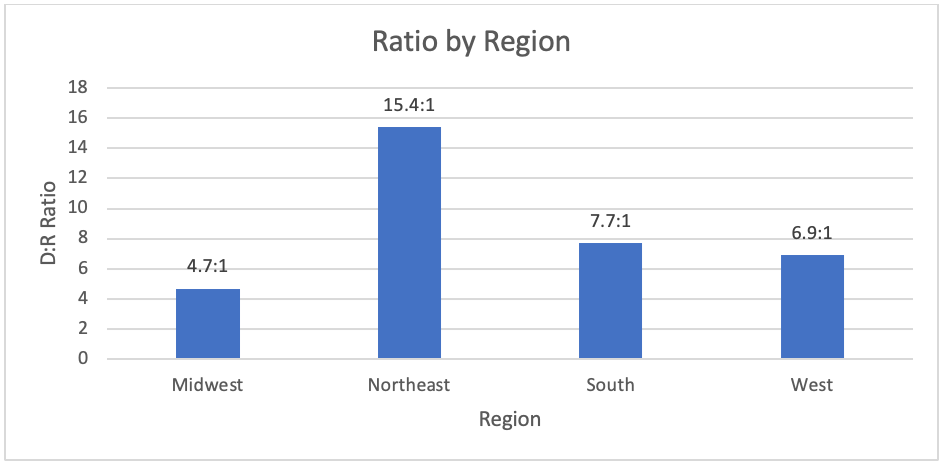
D:R Registration Ratio by Region
The region is also associated with differences in the D:R registration ratio (see Figure 2), which was highest at colleges located in the Northeast (15.4:1). This is consistent with previous work suggesting that political homogeneity among professors is higher in the Northeast (New England, in particular) compared to the rest of the country (Abrams, 2016). The D:R registration ratio in the Northeast is also roughly three times the size of the D:R registration ratio in the Midwest (4.7:1). The South’s D:R ratio may be elevated by remnants of its traditional association with the Democratic Party.
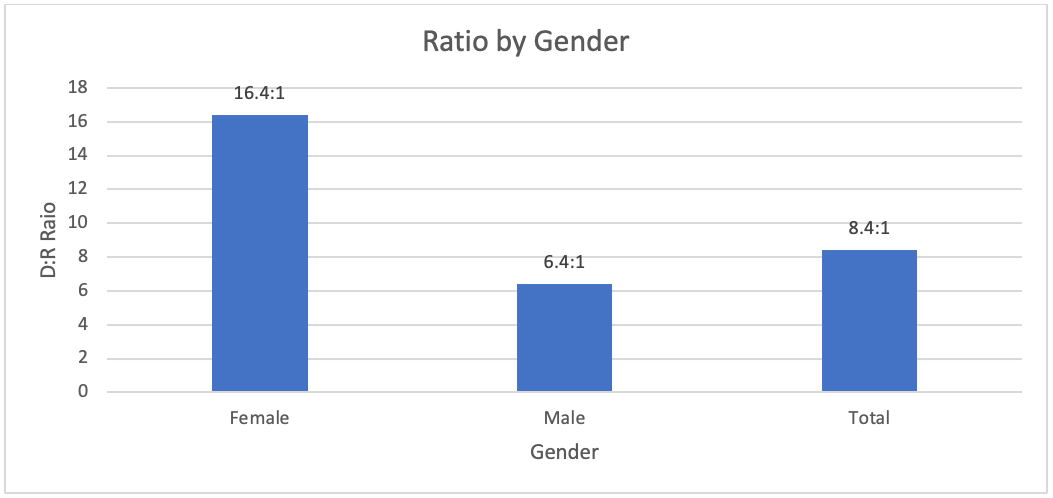
D:R Registration Ratio by Gender
The D:R registration ratio among female faculty (16.4:1) is more than twice the D:R registration ratio among male faculty (6.4:1). Roughly two-thirds of the faculty sampled are male (see Figure 3).
Note: One missing observation
D:R Registration Ratio by Professorial Rank
Differences in the D:R registration ratio by professor rank are also evident, and it was highest among assistant professors (10.5:1) compared to associate (8.7:1) and full professors (8.2:1). It is notable, however, that the percentage of assistant professors not registered to vote (41.4 percent) is roughly double the percentage of full professors not registered to vote (20.3 percent). This discrepancy may be capturing an age or generational effect as well as a national origin effect. The Census Bureau (2018) finds that 62.4 percent of Americans aged 25 to 44 and 71.4 percent of Americans aged 45 to 64 are registered. Professorial rank is a decent proxy for age, with assistant professors more likely to be newly hired and thus having relocated more recently for employment. As well, assistant professors are more likely to be from outside the United States.
D:R Donor Ratio
The overall D:R donation ratio was 95:1. Among the 12,372 professors sampled, in raw numbers, there were 10,260 nondonors, 2,081 Democratic donors, 22 Republican donors, and 9 donors to both parties across both election cycles. According to Hughes (2017), 12 percent of Americans make political donations, so the 17 percent of professors in this sample is above the national average, but it is below the means of 22 percent for Democrats and 32 percent for highly educated Americans. This can in part be explained in part by the 21.3 percent of professors not born in the United States. 1 The donations are almost exclusively to Democratic candidates and committees.
As can be seen in Table 1 below, the overall ratio of Democratic to Republican donors is more extreme than the registration ratio. The ratio of dollars contributed to Democratic versus Republican candidates and committees is $21: $1. As is evident in Table 1, the most elite institutions such as Berkeley, Brown, Bowdoin, Cal Tech, and Colby have the most extreme registration and contribution ratios. It is also apparent that donations are skewed in favor of the Democrats.
| Institution | N | D:R Registration Ratio (Excludes minor parties, not registered, and not affiliated | Number of Donors (Who, over four years donated at least to one dollar to one party) | D:R Donation Ratio (includes nine individuals who donate to both parties | ||||||
|---|---|---|---|---|---|---|---|---|---|---|
| Dem. | Rep. | D:R | Dem. | Rep. | D:R | Dem. | Rep. | D:R | ||
| Alaska Pacific | 15 | 4 | 0 | 4.0:0 | 2 | 0 | 2:0 | $22.80 | $0.00 | $23:0 |
| Alderson Broaddus | 10 | 4 | 2 | 2.0:1 | 0 | 0 | 0:0 | 0.00 | 0.00 | 0:0 |
| Arizona State | 172 | 87 | 7 | 12.4:1 | 26 | 0 | 26:0 | 294.50 | 0.16 | 1,841:1 |
| Augustana | 49 | 19 | 6 | 3.2:1 | 4 | 0 | 4:0 | 12.93 | 0.00 | 13:0 |
| Benedictine | 36 | 6 | 7 | 0.9:1 | 1 | 0 | 1:0 | 1.53 | 0.00 | 13:0 |
| Berea | 38 | 22 | 2 | 11.0:1 | 6 | 0 | 6:0 | 8.67 | 0.00 | 9:0 |
| Berkeley | 171 | 85 | 3 | 28.4:1 | 44 | 0 | 44:0 | 1,226.51 | 0.00 | 1,227:0 |
| Bowdoin | 78 | 45 | 2 | 22.5:1 | 14 | 0 | 44:0 | 33.79 | 0.00 | 34:0 |
| Brown | 149 | 85 | 4 | 21,3:1 | 35 | 1 | 35:1 | 279.90 | 2.48 | 113:1 |
| Brigham Young | 147 | 26 | 48 | 0.5:2 | 8 | 0 | 8:0 | 30.73 | 6.80 | 5:1 |
| Cal Tech | 93 | 42 | 3 | 14.0:1 | 9 | 0 | 9:0 | 32.57 | 0.00 | 33:0 |
| Centre | 59 | 42 | 7 | 6.0:1 | 9 | 0 | 9:0 | 50.38 | 0.00 | 33:0 |
| Colby | 81 | 41 | 4 | 10.3:1 | 9 | 0 | 9:0 | 35.15 | 0.00 | 35:0 |
| Colorado College | 82 | 52 | 4 | 13.0:1 | 11 | 0 | 11:0 | 20.75 | 0.00 | 21:0 |
| Colorado School of Mines | 69 | 26 | 4 | 6.5:1 | 4 | 0 | 4:0 | 31.67 | 0.00 | 32:0 |
| Columbia | 168 | 98 | 4 | 24.5:1 | 45 | 1 | 45:1 | 351.32 | 127.46 | 3:1 |
| Cornell | 159 | 88 | 5 | 17.6:1 | 39 | 1 | 39:1 | 269.48 | 1.38 | 196:1 |
| Creighton | 118 | 57 | 7 | 8.1:1 | 20 | 1 | 20:1 | 36.40 | 0.45 | 81:1 |
| Delaware State | 71 | 29 | 3 | 9.7:1 | 6 | 0 | 6:0 | 6.63 | 0 | 7:0 |
| Dakota Wesleyan | 16 | 4 | 5 | 0.8:1 | 1 | 0 | 1:0 | 7.50 | 0 | 8:0 |
| Dartmouth | 142 | 48 | 5 | 9.6:1 | 38 | 0 | 38:0 | 520 | 0 | 520:0 |
| Davidson | 87 | 45 | 6 | 7.5:1 | 8 | 0 | 8:0 | 71.46 | 2.87 | 25:1 |
| Doane | 30 | 18 | 5 | 3.6:1 | 3 | 0 | 3:0 | 14.60 | 0 | 15:0 |
| Duke | 158 | 74 | 4 | 18.5:1 | 31 | 0 | 31:0 | 253.76 | 0 | 254:0 |
| Eastern Connecticut State | 86 | 48 | 4 | 12.0:1 | 7 | 0 | 7:0 | 9.01 | 0.58 | 16:1 |
| Florida State | 152 | 70 | 6 | 11.7:1 | 25 | 0 | 25:0 | 68.16 | 0 | 68:0 |
| Flagler | 35 | 16 | 2 | 8.0:1 | 5 | 0 | 5:0 | 10.54 | 0 | 11:0 |
| George Washington | 155 | 65 | 3 | 21.7:1 | 23 | 0 | 23:0 | 46.16 | 0 | 46:0 |
| Georgetown | 152 | 75 | 0 | 75:0 | 47 | 0 | 47:0 | 554.98 | 0 | 555:0 |
| Goldey-Beacom | 10 | 3 | 2 | 1.5:1 | 1 | 0 | 1:0 | 6.55 | 0 | 7:0 |
| Grand Canyon | 55 | 16 | 7 | 2.3:1 | 1 | 0 | 1:0 | 8.53 | 0 | 9:0 |
| Grinnell | 101 | 64 | 6 | 10.7:1 | 25 | 0 | 25:0 | 177.66 | 0 | 178:0 |
| Harvard | 159 | 88 | 1 | 88:1 | 41 | 0 | 41:0 | 909.09 | 9.43 | 96:1 |
| Howard | 131 | 59 | 2 | 29.5:1 | 19 | 0 | 19:0 | 82.40 | 0 | 82:0 |
| Iowa State | 142 | 66 | 6 | 11.0:1 | 23 | 2 | 11.5:1 | 239.64 | 35.39 | 7:1 |
| Johns Hopkins | 130 | 57 | 3 | 19.0:1 | 30 | 0 | 30:0 | 276.56 | 0 | 277:0 |
| KSU | 125 | 54 | 11 | 4.9:1 | 20 | 1 | 20:1 | 125.88 | 3.92 | 32:1 |
| Kentucky State | 30 | 17 | 2 | 8.5:1 | 7 | 0 | 7:0 | 16.77 | 0 | 17:0 |
| Keene State | 48 | 17 | 2 | 8.5:1 | 8 | 0 | 8:0 | 59.73 | 0 | 60:0 |
| Kenyon | 76 | 30 | 13 | 2.3:1 | 24 | 0 | 24:0 | 150.60 | 0 | 151:0 |
| Louisiana Tech | 65 | 24 | 8 | 3.0:1 | 5 | 0 | 5:0 | 5.86 | 0 | 6:0 |
| Louisiana State | 131 | 52 | 6 | 8.7:1 | 20 | 0 | 20:0 | 48.72 | 0 | 44:0 |
| Lewis & Clark | 62 | 40 | 2 | 20.0:1 | 7 | 0 | 7:0 | 43.83 | 0 | 49:0 |
| Loyola Maryland | 96 | 53 | 6 | 8.8:1 | 16 | 0 | 9:1 | 28.26 | 0 | 28:0 |
| Loyola New Orleans | 62 | 31 | 5 | 6.2:1 | 9 | 1 | 9:1 | 30.97 | 36.77 | 0.8:1 |
| Luther | 54 | 28 | 8 | 3.5:1 | 9 | 0 | 9:0 | 27.87 | 0 | 28:0 |
| McPherson | 12 | 5 | 2 | 2.5:1 | 2 | 0 | 2:0 | 264.42 | 0 | 264:0 |
| Miami University (OH) | 142 | 59 | 20 | 3.0:1 | 28 | 0 | 28:0 | $25.64 | $0 | $26:0 |
| North Carolina State | 168 | 74 | 12 | 6.2:1 | 16 | 0 | 16:0 | $21.34 | $0 | $21:0 |
| New Mexico State | 117 | 67 | 7 | 9.6:1 | 12 | 0 | 12:0 | 34.51 | 0 | 35:0 |
| Oklahoma Baptist | 30 | 4 | 11 | 0.36:1 | 1 | 0 | 1:0 | 0.37 | 0 | 0.4:0 |
| Oklahoma State | 140 | 71 | 8 | 8.9:1 | 13 | 0 | 13:0 | 23.66 | 0 | 24:0 |
| Oberlin | 90 | 54 | 5 | 10.8:1 | 20 | 0 | 20:0 | 251.87 | 0 | 252:0 |
| Ohio State | 162 | 59 | 16 | 3.7:1 | 30 | 0 | 30:0 | 182.91 | 0 | 183:0 |
| Oregon State | 121 | 71 | 2 | 36:1 | 22 | 0 | 22:0 | 72.05 | 0 | 72:0 |
| Penn | 160 | 82 | 9 | 9.1:1 | 29 | 0 | 29:0 | 193.75 | 0 | 194:0 |
| Penn State | 167 | 92 | 5 | 18.4:1 | 31 | 2 | 15.5:1 | 536.58 | 0 | 537:0 |
| Prescott | 20 | 11 | 0 | 11:0 | 3 | 0 | 3:0 | 21.3 | 0 | 21:0 |
| Princeton | 152 | 80 | 2 | 40:1 | 44 | 0 | 44:0 | 396.19 | 0 | 396:0 |
| Providence | 99 | 33 | 3 | 11:1 | 11 | 0 | 11:0 | 16.05 | 0 | 16:0 |
| Regis | 47 | 28 | 2 | 14:1 | 6 | 0 | 6:0 | 46.70 | 0 | 47:0 |
| Rutgers | 160 | 82 | 6 | 13.7:1 | 41 | 0 | 41:0 | 490.46 | 0 | 490:0 |
| Rutgers Newark | 132 | 65 | 5 | 13:1 | 33 | 1 | 33:1 | 124.14 | 3.03 | 41:0 |
| South Dakota State | 107 | 41 | 14 | 2.9:1 | 4 | 0 | 4:0 | 1.01 | 0 | 1:0 |
| SUNY Binghamton | 155 | 73 | 5 | 14.6:1 | 25 | 0 | 25:0 | 45.08 | 0 | 45:0 |
| SUNY Buffalo | 145 | 79 | 6 | 13.2:1 | 22 | 0 | 22:0 | 31.12 | 0 | 31:0 |
| St. John’s College | 33 | 16 | 6 | 2.7:1 | 2 | 0 | 2:0 | 4.09 | 0 | 4:0 |
| St. Anselm | 72 | 23 | 5 | 4.6:1 | 11 | 1 | 11:1 | 85.74 | 1.67 | 51:1 |
| Stanford | 162 | 77 | 8 | 9.6:1 | 59 | 2 | 30:1 | 871.85 | 224.69 | 4:1 |
| Stevens Institute | 45 | 14 | 1 | 14.0:1 | 2 | 0 | 2:0 | 4.04 | 0 | 4:0 |
| Swarthmore | 85 | 57 | 0 | 57.0:0 | 19 | 0 | 19:0 | 114.85 | 0 | 115:0 |
| Temple | 160 | 79 | 12 | 6.6:1 | 35 | 0 | 35:0 | 179.26 | 0 | 179:0 |
| Tulane | 136 | 48 | 5 | 9.6:1 | 23 | 0 | 23:0 | 115.39 | 0 | 115:0 |
| Univ. Alaska Anchorage | 97 | 46 | 9 | 5.1:1 | 9 | 1 | 9:1 | 33.13 | 2.58 | 13:1 |
| Univ. Alaska Fairbanks | 101 | 39 | 3 | 13.0:1 | 14 | 0 | 14:0 | 65.99 | 0 | 66:0 |
| Univ. Arizona | 160 | 67 | 9 | 7.4:1 | 19 | 0 | 19:0 | 267.52 | 0 | 268:0 |
| Univ. Colorado | 157 | 99 | 2 | 49.5:1 | 24 | 0 | 24:0 | 89.52 | 0 | 90:0 |
| Univ. Kentucky | 151 | 93 | 14 | 6.6:1 | 21 | 1 | 21:1 | 94.77 | 48.34 | 2:1 |
| Univ. South Dakota | 74 | 32 | 6 | 5.3:1 | 2 | 0 | 2:0 | 0.74 | 0 | 0.7:0 |
| Univ. Maine | 115 | 61 | 5 | 12.2:1 | 20 | 0 | 20:0 | 101.10 | 0 | 101:0 |
| Univ. Maine, Farmington | 42 | 19 | 1 | 19:1 | 5 | 0 | 5:0 | 9.50 | 0 | 10:0 |
| Univ. Oregon | 153 | 86 | 2 | 43.0:1 | 23 | 0 | 23:0 | 53.41 | 0 | 53:0 |
| Univ. Southwest | 10 | 1 | 3 | 0.3:1 | 1 | 0 | 1:0 | 49.00 | 0 | 49:0 |
| Univ. Utah | 156 | 47 | 8 | 5.9:1 | 37 | 0 | 37:0 | 154.31 | 0 | 154:0 |
| Univ. Wyoming | 116 | 54 | 9 | 6.0:1 | 14 | 0 | 14:0 | 26.50 | 0 | 27:0 |
| UCLA | 174 | 86 | 11 | 7.8:1 | 39 | 1 | 39:1 | 1059.76 | 83.33 | 13:1 |
| Univ. Conn. | 156 | 84 | 8 | 10.5:1 | 22 | 0 | 22:0 | 17.85 | 0 | 18:0 |
| Univ. Del. | 148 | 55 | 13 | 4.2:1 | 21 | 0 | 21:0 | 122.34 | 0 | 122:0 |
| Univ. Florida | 146 | 75 | 7 | 10.7:1 | 28 | 1 | 28:1 | 129.75 | 3.42 | 38:1 |
| Univ. Iowa | 141 | 91 | 8 | 11.4:1 | 31 | 1 | 31:1 | 150.03 | 3.55 | 42:1 |
| Univ. Kansas | 149 | 71 | 7 | 10.1:1 | 31 | 0 | 31:0 | 142.75 | 0 | 143:0 |
| Univ. Maryland | 154 | 105 | 2 | 53:1 | 33 | 0 | 33:0 | 199.42 | 0 | 199:0 |
| Univ. Mary land Baltimore County | 125 | 62 | 7 | 8.9:1 | 0 | 3 | 0:3 | 0 | 36.03 | 0:36 |
| Univ. Mass. Lowell | 108 | 39 | 3 | 13.0:1 | 10 | 0 | 10:0 | 35.97 | 0 | 36:0 |
| Univ. Mass. Amherst | 149 | 92 | 0 | 92:0 | 14 | 0 | 14:0 | 136.27 | 0 | 136:0 |
| Univ. Miami | 141 | 63 | 8 | 7.9:1 | 29 | 0 | 29:0 | 104.69 | 0 | 105:0 |
| Univ. North Carolina | 166 | 96 | 2 | 48:1 | 31 | 0 | 31:0 | 70.40 | 0 | 70:0 |
| Univ. Nebraska, Lincoln | 132 | 66 | 19 | 3.5:1 | 23 | 0 | 23:0 | 156.54 | 0 | 157:0 |
| Univ. Nebraska, Omaha | 115 | 47 | 16 | 2.9:1 | 10 | 0 | 10:0 | 30.36 | 0 | 30:0 |
| Univ. New Hampshire | 122 | 55 | 8 | 6.9:1 | 26 | 0 | 26:0 | 166.68 | 0 | 167:0 |
| Univ. Nevada, Las Vegas | 137 | 64 | 10 | 6.4:1 | 30 | 0 | 30:0 | $66.42 | $0 | $66:0 |
| Univ. Nevada, Reno | 137 | 70 | 9 | 7.8:1 | 31 | 0 | 31:0 | $143.37 | $0 | $143:0 |
| Univ. New Mexico | 151 | 78 | 5 | 15.6:1 | 13 | 0 | 13:0 | 104.23 | 0 | 104:0 |
| Univ. Oklahoma | 146 | 71 | 8 | 8.9:1 | 19 | 0 | 19:0 | 80.40 | 36.99 | 2:1 |
| Univ. Rhode Island | 103 | 53 | 1 | 53:1 | 8 | 0 | 8:0 | 8.75 | 0 | 9:0 |
| Univ. Tulsa | 85 | 38 | 13 | 2.9:1 | 7 | 0 | 7:0 | 8.28 | 0 | 8:0 |
| Utah State | 135 | 44 | 15 | 2.9:1 | 15 | 0 | 15:0 | 19.37 | 0 | 19:0 |
| Wesley | 24 | 7 | 4 | 1.8:1 | 0 | 0 | 0:0 | 0 | 0 | 0:0 |
| Wesleyan | 141 | 83 | 4 | 21:1 | 40 | 0 | 40:0 | 156.40 | 0 | 156:0 |
| West Liberty | 35 | 8 | 2 | 4:1 | 2 | 0 | 2:0 | 1.29 | 0 | 1:0 |
| West Virginia | 153 | 63 | 6 | 10.5:1 | 9 | 0 | 9:0 | 16.35 | 0 | 16:0 |
| Westminster (UT) | 44 | 19 | 4 | 4.8:1 | 4 | 0 | 5:1 | 11.42 | 0 | 11:0 |
| Wheeling Jesuit | 21 | 7 | 4 | 1.8:1 | 2 | 0 | 2:0 | 10.57 | 0 | 11:0 |
| Willamette | 54 | 35 | 1 | 35:1 | 13 | 0 | 13:0 | 54.62 | 0 | 55:0 |
| Williams | 113 | 62 | 1 | 62:1 | 28 | 0 | 28:0 | 140.80 | 0 | 141:0 |
| Yale | 161 | 94 | 3 | 31.3:1 | 34 | 0 | 34:0 | $351.56 | $0 | $352: 0 |
| Total | 12,372 | 5,991 | 709 | 8.4:1 | 2081 | 22 | 94.6:1 | $177.70 | $8.37 | $21:1 |
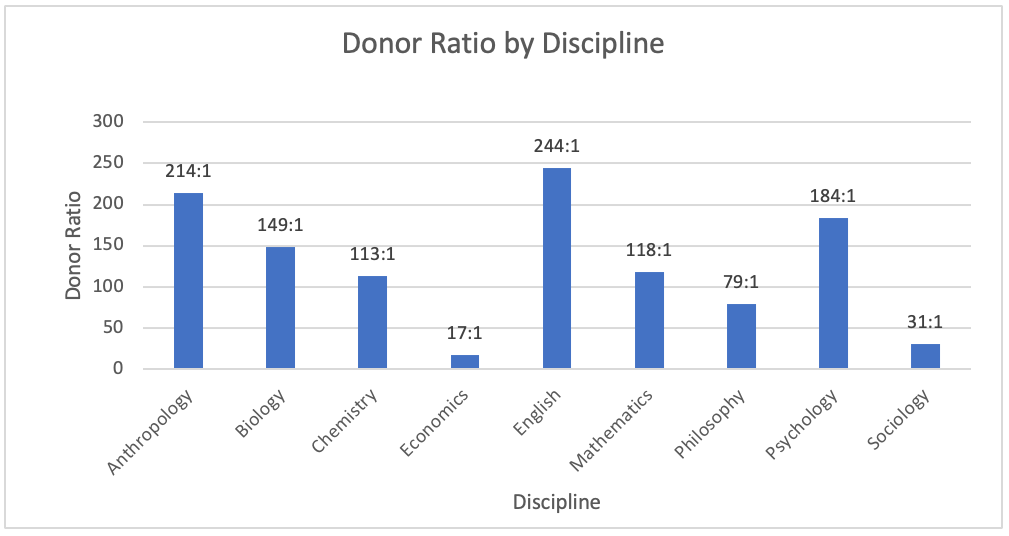
D:R Donor Ratios by Discipline
Across the disciplines sampled, the D:R donor ratio favors the Democrats (see Figure 4). Differences between the natural sciences, the social sciences, and humanities, however, are not as clear. Economics again has the lowest ratio at 17:1. Sociology (31.4:1) and philosophy (79:1) were the two other disciplines for which the D:R donation ratio did not exceed 100:1. Of note, although the D:R registration ratios for chemistry and mathematics did not exceed 6:1, their D:R donor ratios were 113:1 and 118:1 respectively. The percentage of donors within anthropology, English, and philosophy all exceeded 20 percent of the professors sampled from those disciplines respectively.
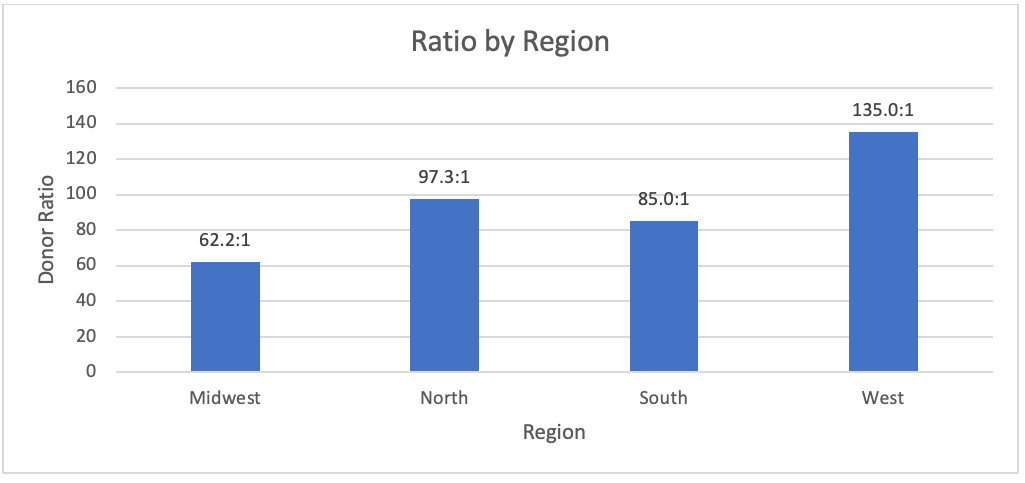
D:R Donor Ratios by Region
In terms of regional differences (see Figure 5), the Northeast (97.3:1) does not have the highest D:R donor ratio, which it does with the D:R registration ratio; rather, the West does at 135:1. Consistent with our findings above for the D:R registration ratio, the Midwest had the lowest D:R donation ratio--at a mere 62.2:1.
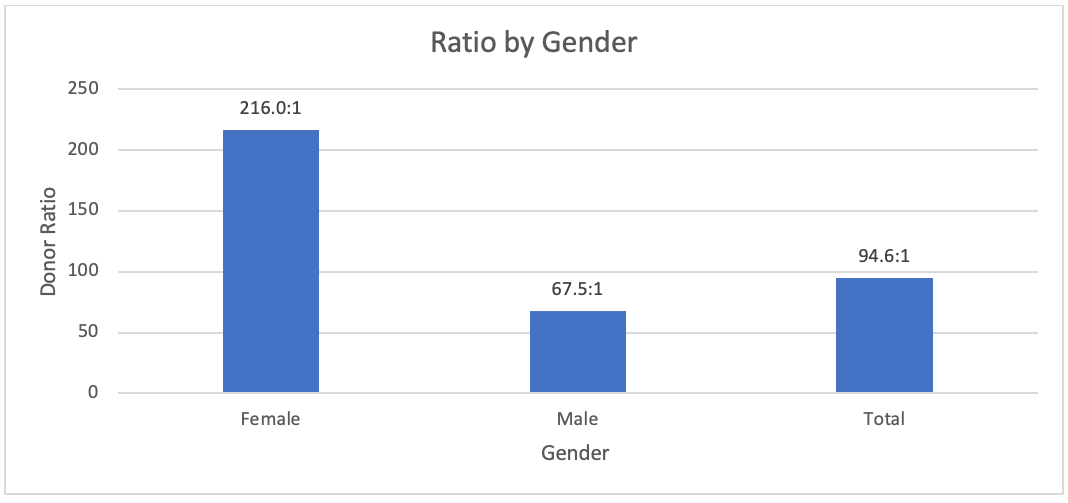
D:R Donor Ratios by Gender
The D:R donation ratio for female professors (216.0:1) was considerably higher than the D:R donation ratio among male professors (67.5:1).
D:R Donor Ratios by Professorial Rank
With respect to professorial rank, the D:R donation ratio was highest among associate professors at 162.1 and lowest among full professors at 68.7:1. Once again, there is evidence of less involvement with party politics among assistant professors, relative to their higher-ranked peers: only 10 percent of the assistant professors sampled made a political contribution, compared to 16 percent of associate professors and 21 percent of full professors (cf., Putnam, 2000).
Triangulating Measures
The two measures of political affiliation, the registration and donation ratios, are closely linked. The chi-square for the frequency chart is 522 (p<.0001), and the relationships are in the expected directions:
| Party Registration | Proportion of Registrants Who Donate to each Party | ||||||
|---|---|---|---|---|---|---|---|
| Both | D | R | None | Total* | Donor D:R Ratio | Sample Size | |
| D | 0.1% | 25.1% | 0.1% | 74.7% | 100.0 | 251:1 | 5,991 |
| R | 0.3 | 6.0 | 1.3 | 92.4 | 100.0 | 4.6:1 | 709 |
| Minor Parties ** | 0.0 | 10.0 | 0 | 90.0 | 100.0 | 10:0 | 235 |
| Reg., Unaffiliated | 0.1 | 10.0 | 0.1 | 90.0 | 100.0 | 50:1 | 2,130 |
| Not Registered | 0.0 | 10.5 | 0.1 | 89.4 | 100.0 | 105:1 | 3,307 |
N=12,372. *Sums differ due to rounding. **Of the 235 professors registered with minor parties, three are registered with the American Independent Party; one is registered with the Constitution Party; 32 are registered with the Green Party; 30 are registered with the Libertarian Party; two are registered with the Working Families Party; 163 are registered with the Independent Party."
Registration rates give a more modest picture of skewness in partisan affiliation among elite academics than donation rates do. Among registered Democratic professors, the donor D:R ratio is 251:1. Among registered Republican professors, the D:R donation ratio also favors Democrats, although at a more modest 4.6:1 rate. It would appear that the professors registered as Republicans often tend to be loosely tied to the Republican Party, so the skewed registration ratios may understate the skewness in academic political affiliation and culture. Among professors registered to minor parties, the D:R donor ratio is 10:0. Among unaffiliated professors, the D:R donor ratio is 50:1. Among professors not registered, the D:R donor ratio is 105:1. These findings triangulate and confirm the overwhelmingly lopsided partisanship in leading colleges.
Summary and Conclusion
The D:R donation ratio and the D:R registration ratio tell a story that is broadly consistent. The D:R donation ratio favors the Democratic Party in all nine disciplines sampled. Compared to the D:R registration ratio, the skewness in the D:R donation ratio for each discipline is more extreme than for registration. For six of the eight or nine disciplines, the D:R donation ratio exceeds 100:1. The D:R donation ratio among female professors is greater than among their male counterparts, and the ratios are lowest in the Midwest. It is also evident that assistant professors are less engaged in party politics as measured by the smaller percentage who register and who make political contributions.
However, the D:R donation rate is highest in the West, not in the Northeast, while with respect to registration it is highest in the Northeast. The donation ratio is also highest among associate professors while the registration ratio is highest for full professors. Whereas with the D:R registration ratios the natural sciences have the least skewness, this was not the case for the D:R donation ratios; economics has the least.
The findings regarding assistant professors are also noteworthy. The D:R registration ratio is highest among this cohort, yet they are also more likely not to be registered to vote. When one also considers that 90 percent of the assistant professors sampled also did not make a political contribution in the 2016 or 2018 federal election cycle, then one plausible interpretation of our findings is that assistant professors are less likely to be involved in traditional party politics, although there is no evidence that is inconsistent with the broad evidence that conservatives and Republicans are absent from leading colleges around the country.
The trend for the D:R registration ratio among the professoriate to increase will likely continue because the D:R registration ratio is highest among assistant professors in our sample. This presumably would also produce an even greater D:R donation ratio.
1 Of the 12,372 professors in the sample, information about the undergraduate institution each attended is available for 8,651. Of these, 1,839 attended a non-US undergraduate institution. The percentage of the non-US-undergrad professors who are not registered to vote is 60.1 percent, while the percentage of the professors who attended a US-based undergraduate institution who are not registered is 16.8 percent. Thus, 49.2 percent of non-registered professors attended a non-US-based undergraduate institution, but they are only 21.3 percent of the sample for which data is available. Similarly, while 8.9 percent of professors who attended a foreign undergraduate institution are donors, 19.4 percent of those who attended a US-based institution are donors.
References
Abrams, S. J. 2016. “There Are Conservative Professors. Just Not in These States.” New York Times, July 1, 2016. Downloaded on November 21, 2019 at https://www.nytimes.com/2016/07/03/opinion/sunday/there-are-conservative-professors-just-not-in-these-states.html .
Buchanan, J. and Tullock, G. 1962. The Calculus of Consent Logical Foundations of Constitutional Democracy. Ann Arbor, MI: University of Michigan Press.
Buss, D.M. and von Hippel, W. 2018. “Psychological barriers to evolutionary psychology: Ideological bias and coalitional adaptations.” Archives of Scientific Psychology, 6:1, 148-158. Downloaded on November 21, 2019 at https://psycnet.apa.org/fulltext/2018-57934-001.html .
Caplan, B. 2007. The Myth of the Rational Voter: Why Democracies Choose Bad Policies. Princeton, NJ: Princeton University Press.
Census Bureau. 2019. “Voting and Registration in the Election of 2018.” Release Number P20, Tables. https://www.census.gov/data/tables/time-series/demo/voting-and-registration/p20-583.html. Accessed September 26, 2019.
Downs, A. 1957. An Economic Theory of Democracy. New York: Harper and Row.
Duarte, José L., Jarret T. Crawford, Charlotta Stern, Jonathan Haidt, Lee Jussim, and Philip E. Tetlock. 2015. “Political Diversity Will Improve Social Psychological Science Behavioral and Brain Sciences. 38: e130. Downloaded on November 21, 2019 at https://www.cambridge.org/core/journals/behavioral-and-brain-sciences/article/political-diversity-will-improve-social-psychological-science-1/A54AD4878AED1AFC8BA6AF54A890149F
Federal Elections Commission. 2019. “Campaign Finance Data.” https://www.fec.gov/ . Accessed on September 26, 2019.
Gross, N. ,and Simmons, S. 2007. “The Social and Political Views of American Professors.” Working Paper, downloaded on Nov. 21, 2019 at . https://www.conservativecriminology.com/uploads/5/6/1/7/56173731/lounsbery_9-25.pdf ,
Honeycutt, N. and Freberg, L. 2017. “The Liberal and Conservative Experience Across Academic Disciplines: An Extension of Inbar and Lammers. Social Psychological and Personality Science. 8:2, 115-123
Jones, J., M. 2016. “Democratic, Republican Identification Near Historical Lows.” Gallup, January 11, 2016. https://news.gallup.com/poll/188096/democratic-republican-identification-near-historical-lows.aspx . Accessed on September 26, 2019.
Hughes, A. 2017. “5 Facts about US Political Donations.” Pew Research Center, May 17, 2017. https://www.pewresearch.org/fact-tank/2017/05/17/5-facts-about-u-s-political-donations/. Accessed on September 26, 2019.
Jussim, L, Crawford, JT, Anglin, SM, Stevens, ST, and Duarte, JL. 2016. “Interpretations and Methods: Towards a More Effectively Self-Correcting Social Psychology.” Journal of Experimental Social Psychology 66:116-133.
Klein, D. B. and Stern, C. 2005. “Professors and Their Politics: The Policy Views of Social Scientists.” Critical Review 17 (3-4): 257-303.
Klein, D. B. and Stern, C. 2006. “Sociology and Classical Liberalism.” Independent Review 11(1):37–52.
Laloggia, J. "6 facts about U.S. political independents.” Pew Research Center, May 15, 2019. https://www.pewresearch.org/fact-tank/2019/05/15/facts-about-us-political-independents/ . Accessed on September 26, 2019.
M. 2018. “Homogeneous: The Political Affiliations of Elite Liberal Arts Faculty.” Academic Questions 31:2, Summer 2018. https://www.nas.org/academic-questions/31/2 . Accessed on September 26, 2019.
Langbert, M. Quain, A. and Klein, D. 2016. “Faculty Voter Registration in Economics, History, Journalism, Law, and Psychology.” Econ Journal Watch 13:3, September 2013. https://econjwatch.org/articles/faculty-voter-registration-in-economics-history-journalism-communications-law-and-psychology. Accessed on September 26, 2019.
McClintock, C. G., Spaulding, C. B. , Turner, H.A.1965. “Political Orientations of Academically Affiliated Psychologists.” American Psychologist 20(3): 211–221.
Olson, M. 1965. The Logic of Collective Action. Boston, MA: Harvard University Press.
Oliphant, J. B. 2019 “6 Facts about Democrats as the Party Holds Its Presidential Debates." Pew Research Center, June 26, 2019. https://www.pewresearch.org/fact-tank/2019/06/26/facts-about-democrats/ Accessed Sept. 26, 2019
Olson, M. 1982. The Rise and Decline of Nations. New Haven, CT.: Yale University Press.
Parker, K., 2019. “The Growing Partisan Divide in Views of Higher Education." Pew Research Center, August 19, 2019. "https://www.pewsocialtrends.org/essay/the-growing-partisan-divide-in-views-of-higher-education/. Accessed Sept. 26, 2019.
Putnam, R. Bowling Alone. New York: Simon and Schuster, 2000.
Rothman, S., Lichter, S.R., and Nevitte, N. 2005. Politics and Professional Advancement Among College Faculty. The Forum. Downloaded on November 21, 2019 at http://www.conservativecriminology.com/uploads/5/6/1/7/56173731/rothman_et_al.pdf
Saad, L., 2017. "US Conservatives Outnumber Liberals by Narrowing Margin." Gallup, January 23, 2017. https://news.gallup.com/poll/201152/conservative-liberal-gap-continues-narrow-tuesday.aspx. Accessed on September 26, 2019
Saad, L.. 2019. “US Still Leans Conservative, but Liberals Keep Recent Gains.” Gallup, January 8, 2019. https://news.gallup.com/poll/245813/leans-conservative-liberals-keep-recent-gains.aspx. Accessed on September 26, 2019.
Stevens, S.T., Jussim, L., Anglin, S.M., and Honeycutt, N. 2019. “Direct and indirect influences of political ideology on perceptions of scientific findings.” In B.T. Rutgens and M.J. Brandt (Eds.) Belief Systems and the Perception of Reality.
Tandberg, D. 2010. Politics, Interest Groups, and the State Funding of Higher Education. Research In Higher Education, 51:416-450.
Voter Lists Online. 2019. Aristotle. http://aristotle.com/voterlists/. Accessed September 26, 2019.
Yancey, G. A. 2011. Compromising Scholarship: Religious and Political Bias in American Higher Education. Waco, Tex.: Baylor University Press.
Photo by Parker Johnson on Unsplash