Charles L. Geshekter is emeritus professor of history at California State University, Chico, California 95929-0735. This address was originally presented at “Race and Gender Preferences at the Crossroads,” a conference organized by the California Association of Scholars and co-sponsored by the American Civil Rights Institute (ACRI) and the Center for Equal Opportunity, held January 19, 2008, at the University of Southern California, Los Angeles, California. A longer version of the original article is available from the ACRI, P.O. Box 188350, Sacramento, CA 95818. The author is grateful to Roger Clegg, Sharon Browne, Jay Bergman, John Ellis, and Ward Connerly for their cogent suggestions and valuable criticisms of earlier drafts.
David Randall is Director of Research at the National Association of Scholars. He has updated Charles Geshekter’s 2008 article for 2020.
Please contact Dr. Randall ([email protected]) with any queries about this article.
California’s state legislature just passed Assembly Constitutional Amendment No. 5 (ACA-5), which will allow California’s voters on Election Day in November 2020 to repeal Proposition 209, which “prohibits the state from discriminating against, or granting preferential treatment to, any individual or group on the basis of race, sex, color, ethnicity, or national origin in the operation of public employment, public education, or public contracting.” Such a repeal would be disastrous for Californians. Proposition 209 has enhanced California’s good civic reputation since 1996, as an institutional support of the American principle of equal opportunity for all individual American citizens. It has also worked well: all Californian citizens have done well under Proposition 209, especially in higher education and public contracting.
Prof. Charles Geshekter’s 2008 article, “The Effects of Proposition 209 on California: Higher Education, Public Employment, and Contracting,” superbly demonstrated how well Proposition 209 had functioned until then. It remains in heavy demand to this day, especially now in 2020, as Californians debate whether or not to repeal Proposition 209. However, Prof. Geshekter’s article does not include more current data. The National Association of Scholars has therefore updated Prof. Geshekter’s article. This version adds new data, and includes small rewordings of the original text, to fit the revised data.
The data since 2008 continues to demonstrate how well Proposition 209 has worked for all Californians. We urge all Californians to vote against ACA-5, and preserve Proposition 209. Prof. Geshekter’s updated article shows in detail why they should.
Introduction
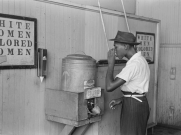
In 1996, Californians overwhelmingly approved Proposition 209 that prohibited all state agencies from using anyone’s race, ethnicity, or gender to discriminate against them or give them preference in university admissions, public employment, or competition for a state contract.
Those who opposed Proposition 209 predicted that ending racial or gender favoritism would result in sharp declines in black and Hispanic college enrollments, setbacks for women in public employment, reduced funds for cancer detection centers and domestic violence shelters, or other alarmingly negative effects.
This article compares such dire predictions with documentary evidence provided by the State Personnel Board, the Department of Finance, the University of California (UC), and California State University (CSU). It relies on data concerning admissions, retention, and graduation of undergraduates from the CSU system and the UC and reviews faculty hiring patterns within both systems. Other tables compare the numbers of white, black, Hispanic, males and females employed in a variety of California state agencies in 1997, after Proposition 209 was approved, nine years later in 2006, and then in 2009/2010, 2014, and 2018.
These statistics document the progress made towards social justice under Proposition 209 and may encourage voters in other states who want to assure that preferential treatment (regardless of whatever else it may euphemistically be called) becomes a thing of the past in the operation of their respective state governments.
These data offer many uncomfortable truths to defenders of racial preferences and gender double standards whose unscrupulous attacks on voter initiatives are likely to persist, regardless of the facts from California. Defenders of double standards and group preferences insinuate that American voters in 2020 cannot understand the simple, straightforward language of the civil rights legislation of the 1960s. So immersed in the doubletalk of diversity and obsessed with achieving proportional representation in all walks of life, diversity crusaders ignore or dismiss any good news, repeating their tiresome mantra that without racial preferences or gender double standards a chilly climate for diversity will envelop the workplace and campuses.
This article demonstrates the dishonesty of such claims. The UC and CSU systems continue to accelerate higher education success for all students by promoting educational practices that support everyone’s academic achievement. The CSU and UC data show that blacks, Hispanics, and other underrepresented groups have suffered no harm, but have steadily increased in the statistically significant areas of high school graduates and university baccalaureate holders across the state.
Despite the constant refrain about needing an “even playing field,” the fact is that getting admitted to a university or starting an academic career or landing a construction contract is not some game. When playing “the diversity game,” the defenders of racial preferences or gender double standards prefer to play by no rules. They ignore the fact that disparities in any social category are not proof of discrimination, and that social scientists and geneticists have long recognized that variations within any group are far greater than any variations between such groups.
Proposition 209 in no way hindered the progress of minorities and women in public employment. Predictions about a future deterioration of labor market positions for women and minorities proved utterly unfounded.
In the construction industry, the end of racial preferences and gender set-asides resulted in a decline in the number of certified female- and minority-led businesses that had previously relied on favoritism (Women’s Business Enterprises [WBE] and Minority Business Enterprises [MBE]). This was not a surprising development. Meticulous investigations by the Discrimination Research Center, led by researchers who opposed Proposition 209, confirmed that many of the firms that went out of business after 1997 were not competitive to begin with, a fact that the successful women and ethnic minority business owners seemed easily to grasp when interviewed. By banning quotas and double standards in awarding state construction contracts, the implementation of Proposition 209 saved California millions of dollars (as demonstrated in studies by economist Justin Marion cited below).
The available evidence offers no support for ominous predictions made by opponents of Proposition 209 that the measure would “turn back the clock” on women’s progress or undermine equal opportunities for ethnic minorities.1 A study from Michigan nonetheless claimed in 2005 that Proposition 209 had “eroded access to services, education, job training and other opportunities for women.2 Defenders of gender preferences and set-asides, such as One United Michigan, warned that ending such policies would, in Michigan as in California, “hurt women and girls.” But nothing of the sort ever happened in California.3
The hiring and promotion of women as faculty at the CSU and UC systems continued to increase. Women enrolled and graduated in greater numbers than men at the UC and CSU, and majored in a broad cross-section of fields including natural sciences, computer science, mathematics, and technology studies.
While none of this data may ever convince those who still staunchly oppose Proposition 209, it does rebut their predictions that initiatives like Proposition 209 jeopardize women and ethnic minorities. Shanta Driver, the national spokesperson for By Any Means Necessary (BAMN) alleged in 2007 that “the initiatives had a ‘devastating impact’ on ‘under-represented’ groups.”4
One searches in vain for such evidence. Allegations like Driver’s rely on abusive terms like “resegregation” or outright fabrications to allege that damage is caused by eliminating racial and gender preferences. Such unsubstantiated claims often receive the uncritical attention of the media that treat them as “moral statistics” requiring no verification. This report corrects these erroneous impressions by reviewing actual statistical information available on California.
University of California Baccalaureates
Disparities in student academic performances in secondary schools are due, of course, to a variety of bitterly debated factors regarding learning conditions. These include stable home environments, nature of parental supervision, socio-economic status, and the quality of neighborhood schools in terms of qualified teachers and counselors, properly equipped facilities, textbooks, and advanced course availability. In addition, ethnic and racial communities vary in their income levels, the importance that each attaches to educational achievement, the presence of books in the home, the amount of television a child is allowed to watch, and a household’s familiarity with higher education.5
Contrary to relentlessly negative predictions, the numbers of black and Hispanic undergraduates that were newly enrolled system-wide at the University of California rose steadily from 1998 to 2006. The elimination of ethnic preferences and the prohibition against racial double standards in admissions led to a redistribution of students among the ten-campus system, with fewer only at the most competitive flagship campuses of Berkeley and UCLA.
While there was a significant drop in the numbers of black and Hispanic students at Berkeley and UCLA between 1999 and 2006, Table 1 indicates the greater success that ethnic minorities had in actually completing a baccalaureate degree when they attended a UC campus that offered an apparently better match for their academic backgrounds and preparation.
| UC System | 1999 | 2000 | 2001 | 2002 | 2003 | 2004 | 2005 | 2006 | Change, '99-'06 |
|---|---|---|---|---|---|---|---|---|---|
| Asian | 10,485 | 10,578 | 10,962 | 12,035 | 12,686 | 13,744 | 14,076 | 14,383 | 37% |
| Black | 1,139 | 1,034 | 1,023 | 1,,025 | 1,056 | 1,086 | 1,158 | 1,170 | 3% |
| Hispanic | 3,984 | 3,899 | 4,099 | 4,223 | 4,582 | 5,981 | 5,258 | 5,287 | 33% |
| White | 12,922 | 13,116 | 13,631 | 14,389 | 14,649 | 15,120 | 15,073 | 15,127 | 17% |
| All | 31,949 | 40,962 | 28% | ||||||
| UC Berkely | 1999 | 2000 | 2001 | 2002 | 2003 | 2004 | 2005 | 2006 | Change, '99-'06 |
| Asian | 2,303 | 2,213 | 2,269 | 2,533 | 2,596 | 2,667 | 2,613 | 2,533 | 10% |
| Black | 286 | 275 | 258 | 196 | 245 | 226 | 219 | 219 | -23% |
| Hispanic | 670 | 616 | 585 | 535 | 580 | 623 | 701 | 636 | -5% |
| White | 1,985 | 1,761 | 1,906 | 1,988 | 2,043 | 2,026 | 1,995 | 2,075 | 4% |
| All | 6,102 | 6,446 | 6% | ||||||
| UC Davis | 1999 | 2000 | 2001 | 2002 | 2003 | 2004 | 2005 | 2006 | Change, '99-'06 |
| Asian | 1,575 | 1,498 | 1,500 | 1,665 | 1,763 | 1,934 | 1,127 | 1,270 | 44% |
| Black | 130 | 135 | 114 | 143 | 145 | 133 | 138 | 142 | 8% |
| Hispanic | 443 | 394 | 429 | 422 | 536 | 562 | 531 | 577 | 23% |
| White | 2,027 | 2,035 | 2,121 | 2,293 | 2,468 | 2,459 | 2,488 | 2,396 | 18% |
| All | 4,642 | 5,894 | 27% | ||||||
| UC Irvine | 1999 | 2000 | 2001 | 2002 | 2003 | 2004 | 2005 | 2006 | Change, '99-'06 |
| Asian | 1,675 | 1,799 | 1,799 | 1,980 | 2,253 | 2,494 | 2,461 | 2,418 | 44% |
| Black | 65 | 63 | 62 | 84 | 76 | 86 | 126 | 115 | 43% |
| Hispanic | 367 | 337 | 367 | 432 | 389 | 543 | 593 | 531 | 31% |
| White | 770 | 727 | 812 | 983 | 1,050 | 1,286 | 1,267 | 1,286 | 67% |
| All | 3,181 | 5,021 | 57% | ||||||
| UCLA | 1999 | 2000 | 2001 | 2002 | 2003 | 2004 | 2005 | 2006 | Change, '99-'06 |
| Asian | 2,202 | 2,211 | 2,427 | 2,392 | 2,492 | 2,560 | 2,496 | 2,529 | 14% |
| Black | 355 | 299 | 267 | 243 | 240 | 236 | 226 | 197 | -44% |
| Hispanic | 1,002 | 915 | 274 | 914 | 935 | 1,051 | 1,057 | 1,072 | 7% |
| White | 2,197 | 2,326 | 2,490 | 2,492 | 2,465 | 2,530 | 2,408 | 2,401 | 9% |
| All | 6,195 | 6,958 | 12% | ||||||
| UC Riverside | 1999 | 2000 | 2001 | 2002 | 2003 | 2004 | 2005 | 2006 | Change, '99-'06 |
| Asian | 611 | 747 | 792 | 942 | 1,084 | 1,178 | 1,276 | 1,338 | 118% |
| Black | 87 | 83 | 109 | 117 | 152 | 177 | 198 | 218 | 60% |
| Hispanic | 367 | 389 | 464 | 531 | 621 | 668 | 751 | 737 | 50% |
| White | 552 | 578 | 566 | 644 | 720 | 714 | 694 | 706 | 27% |
| All | 1,762 | 3,317 | 88% | ||||||
| UC San Diego | 1999 | 2000 | 2001 | 2002 | 2003 | 2004 | 2005 | 2006 | Change, '99-'06 |
| Asian | 1,265 | 1,278 | 1,288 | 1,500 | 1,443 | 1,867 | 2,070 | 1,952 | 54% |
| Black | 65 | 58 | 57 | 64 | 50 | 59 | 58 | 69 | 6% |
| Hispanic | 319 | 392 | 274 | 407 | 387 | 452 | 464 | 513 | 61% |
| White | 1,474 | 1,567 | 1,661 | 1,688 | 1,657 | 1,867 | 1,883 | 1,831 | 24% |
| All | 3,530 | 5,061 | 43% | ||||||
| UC Santa Barbara | 1999 | 2000 | 2001 | 2002 | 2003 | 2004 | 2005 | 2006 | Change, '99-'06 |
| Asian | 591 | 546 | 537 | 596 | 626 | 613 | 696 | 738 | 24% |
| Black | 89 | 77 | 104 | 111 | 94 | 100 | 124 | 124 | 40% |
| Hispanic | 495 | 534 | 573 | 617 | 638 | 695 | 738 | 747 | 51% |
| White | 2,467 | 2,642 | 2,651 | 2,716 | 2,579 | 2,587 | 2,598 | 2,604 | 5% |
| All | 4,058 | 4,823 | 19% | ||||||
| UC Santa Cruz | 1999 | 2000 | 2001 | 2002 | 2003 | 2004 | 2005 | 2006 | Change, '99-'06 |
| Asian | 229 | 281 | 345 | 420 | 421 | 428 | 536 | 587 | 156% |
| Black | 60 | 43 | 52 | 66 | 54 | 69 | 69 | 84 | 40% |
| Hispanic | 314 | 318 | 325 | 333 | 296 | 286 | 422 | 460 | 46% |
| White | 1,410 | 1,475 | 1,417 | 1,577 | 1,658 | 1,644 | 1,740 | 1,812 | 28% |
| All | 2,385 | 3,388 | 42% |
Between 2007 and 2018, the numbers of black, Hispanic, and Asian students boomed at all UC campuses—and black and Hispanic students at Berkeley and UCLA more than made up their temporary decline in numbers between 1999 and 2006. Whites were the only ethnic group in California whose numbers declined in the UC system during these years.
| UC System | 2007 | 2008 | 2009 | 2010 | 2011 | 2012 | 2013 | 2014 | 2015 | 2016 | 2017 | 2018 | Change, '07-'18 |
| Asian/Pacific Islander | 15320 | 15587 | 16802 | 17842 | 18125 | 18224 | 18328 | 18597 | 18638 | 19178 | 19265 | 19403 | 27% |
| African American | 1152 | 1251 | 1291 | 1386 | 1618 | 1659 | 1634 | 1609 | 1828 | 1888 | 1997 | 2061 | 79% |
| Hispanic/Latino | 5681 | 5842 | 6144 | 6897 | 7648 | 8477 | 8667 | 9656 | 10546 | 11417 | 11865 | 12692 | 123% |
| White | 15268 | 15280 | 15752 | 15946 | 16116 | 15759 | 14435 | 14113 | 13591 | 13956 | 13839 | 13584 | -11% |
| All | 42464 | 42838 | 45110 | 47153 | 49100 | 49117 | 48249 | 49416 | 50860 | 53911 | 55537 | 57203 | 35% |
| UC Berkeley | 2007 | 2008 | 2009 | 2010 | 2011 | 2012 | 2013 | 2014 | 2015 | 2016 | 2017 | 2018 | Change, '07-'18 |
| Asian/Pacific Islander | 2828 | 3007 | 2877 | 3035 | 2925 | 2969 | 2907 | 2889 | 2948 | 2983 | 2956 | 3347 | 18% |
| African American | 185 | 213 | 239 | 265 | 247 | 236 | 231 | 233 | 254 | 255 | 277 | 271 | 46% |
| Hispanic/Latino | 732 | 750 | 780 | 856 | 838 | 925 | 930 | 955 | 990 | 991 | 1129 | 1236 | 69% |
| White | 2258 | 2367 | 2310 | 2306 | 2277 | 2447 | 2195 | 2190 | 1970 | 2183 | 2231 | 2209 | -2% |
| All | 6960 | 7249 | 7092 | 7466 | 7526 | 7775 | 7565 | 7647 | 7457 | 7906 | 8213 | 8727 | 25% |
| UC Davis | 2007 | 2008 | 2009 | 2010 | 2011 | 2012 | 2013 | 2014 | 2015 | 2016 | 2017 | 2018 | Change, '07-'18 |
| Asian/Pacific Islander | 2267 | 2251 | 2461 | 2579 | 2602 | 2761 | 2624 | 2966 | 2983 | 2967 | 2885 | 2665 | 18% |
| African American | 129 | 154 | 141 | 169 | 187 | 212 | 191 | 193 | 229 | 264 | 238 | 274 | 112% |
| Hispanic/Latino | 577 | 597 | 704 | 736 | 852 | 992 | 1016 | 1149 | 1246 | 1343 | 1425 | 1548 | 168% |
| White | 2199 | 2175 | 2345 | 2312 | 2402 | 2452 | 2264 | 2195 | 2361 | 2287 | 2281 | 2059 | -6% |
| All | 5785 | 5762 | 6369 | 6511 | 6738 | 7015 | 6765 | 7120 | 7560 | 7855 | 8137 | 7993 | 38% |
| UC Irvine | 2007 | 2008 | 2009 | 2010 | 2011 | 2012 | 2013 | 2014 | 2015 | 2016 | 2017 | 2018 | Change, '07-'18 |
| Asian/Pacific Islander | 2490 | 2746 | 3094 | 3285 | 3225 | 3067 | 3120 | 3218 | 3068 | 2998 | 2932 | 3040 | 22% |
| African American | 94 | 105 | 148 | 107 | 156 | 132 | 143 | 158 | 199 | 205 | 192 | 223 | 137% |
| Hispanic/Latino | 592 | 683 | 676 | 820 | 911 | 950 | 937 | 1235 | 1531 | 1685 | 1790 | 2048 | 246% |
| White | 1422 | 1504 | 1492 | 1508 | 1478 | 1294 | 1270 | 1284 | 1077 | 1171 | 1159 | 1217 | -14% |
| All | 5209 | 5265 | 5962 | 6298 | 6378 | 5963 | 5997 | 6414 | 6570 | 7148 | 7265 | 8063 | 55% |
| UCLA | 2007 | 2008 | 2009 | 2010 | 2011 | 2012 | 2013 | 2014 | 2015 | 2016 | 2017 | 2018 | Change, '07-'18 |
| Asian/Pacific Islander | 2539 | 2586 | 2939 | 2891 | 2758 | 2658 | 2744 | 2836 | 2708 | 2777 | 2778 | 2712 | 7% |
| African American | 239 | 236 | 216 | 241 | 267 | 320 | 263 | 278 | 285 | 317 | 384 | 390 | 63% |
| Hispanic/Latino | 1094 | 1068 | 1033 | 1105 | 1111 | 1200 | 1188 | 1385 | 1520 | 1694 | 1710 | 1686 | 54% |
| White | 2514 | 2678 | 2692 | 2709 | 2606 | 2550 | 2364 | 2482 | 2283 | 2429 | 2379 | 2391 | -5% |
| All | 7137 | 7392 | 7797 | 7764 | 7591 | 7499 | 7515 | 8222 | 8266 | 8665 | 8686 | 8599 | 20% |
| UC Riverside | 2007 | 2008 | 2009 | 2010 | 2011 | 2012 | 2013 | 2014 | 2015 | 2016 | 2017 | 2018 | Change, '07-'18 |
| Asian/Pacific Islander | 1537 | 1223 | 1220 | 1381 | 1579 | 1729 | 1792 | 1685 | 1629 | 1750 | 1823 | 1725 | 12% |
| African American | 220 | 189 | 230 | 261 | 311 | 342 | 339 | 271 | 281 | 261 | 264 | 272 | 24% |
| Hispanic/Latino | 793 | 752 | 796 | 945 | 1125 | 1321 | 1450 | 1617 | 1561 | 1544 | 1604 | 1649 | 108% |
| White | 663 | 611 | 675 | 632 | 717 | 757 | 730 | 721 | 618 | 629 | 675 | 548 | -17% |
| All | 3544 | 3055 | 3190 | 3464 | 4040 | 4402 | 4576 | 4587 | 4392 | 4480 | 4685 | 4520 | 28% |
| UC San Diego | 2007 | 2008 | 2009 | 2010 | 2011 | 2012 | 2013 | 2014 | 2015 | 2016 | 2017 | 2018 | Change, '07-'18 |
| Asian/Pacific Islander | 2189 | 2303 | 2633 | 2952 | 3069 | 2926 | 2919 | 2502 | 2678 | 3065 | 2995 | 2946 | 35% |
| African American | 54 | 84 | 67 | 89 | 119 | 110 | 121 | 98 | 114 | 153 | 158 | 157 | 191% |
| Hispanic/Latino | 504 | 584 | 618 | 724 | 744 | 843 | 849 | 850 | 923 | 1040 | 1098 | 1079 | 114% |
| White | 1760 | 1650 | 1734 | 1735 | 1704 | 1677 | 1494 | 1362 | 1456 | 1626 | 1516 | 1573 | -11% |
| All | 5328 | 5323 | 5857 | 6336 | 6526 | 6344 | 6148 | 5600 | 6203 | 7207 | 7356 | 7609 | 43% |
| UC Santa Barbara | 2007 | 2008 | 2009 | 2010 | 2011 | 2012 | 2013 | 2014 | 2015 | 2016 | 2017 | 2018 | Change, '07-'18 |
| Asian/Pacific Islander | 835 | 786 | 785 | 842 | 848 | 983 | 954 | 1197 | 1278 | 1309 | 1366 | 1436 | 72% |
| African American | 146 | 175 | 172 | 128 | 173 | 163 | 160 | 167 | 227 | 201 | 216 | 245 | 68% |
| Hispanic/Latino | 862 | 881 | 927 | 967 | 1163 | 1180 | 1093 | 1111 | 1188 | 1267 | 1354 | 1482 | 72% |
| White | 2550 | 2442 | 2595 | 2803 | 2671 | 2486 | 2266 | 2034 | 2024 | 2038 | 1943 | 1970 | -23% |
| All | 4977 | 4881 | 5005 | 5212 | 5358 | 5222 | 4871 | 4873 | 5235 | 5373 | 5606 | 5882 | 18% |
| UC Santa Cruz | 2007 | 2008 | 2009 | 2010 | 2011 | 2012 | 2013 | 2014 | 2015 | 2016 | 2017 | 2018 | Change, '07-'18 |
| Asian/Pacific Islander | 613 | 589 | 657 | 749 | 918 | 851 | 929 | 958 | 1007 | 982 | 1166 | 1189 | 94% |
| African American | 83 | 76 | 63 | 106 | 113 | 99 | 106 | 112 | 138 | 138 | s | 156 | 88% |
| Hispanic/Latino | 509 | 462 | 522 | 611 | 713 | 794 | 827 | 966 | 1139 | 1264 | 1160 | 1280 | 151% |
| White | 1879 | 1767 | 1824 | 1845 | 2090 | 1891 | 1648 | 1671 | 1589 | 1409 | 1497 | 1434 | -24% |
| All | 3450 | 3271 | 3488 | 3701 | 4301 | 4038 | 3762 | 3896 | 4016 | 3982 | 4270 | 4395 | 27% |
In 1999, black students earned a total of 1,139 bachelor’s degrees from the UC. In 2006, that number had increased 3% to 1,170. By 2018, black students earned a total of 2061 bachelor’s degrees from the UC, an increase of 81% since 1999.
In 1999, Hispanic students earned a total of 3,984 bachelor’s degrees from the UC. In 2006, that number had increased by 33%, for a total of 5,287 degrees. By 2018, Hispanic students earned a total of 12692 bachelor’s degrees from the UC, an increase of 219% since 1999.
In 1999, a total of 10,485 Asians earned bachelor’s degrees; in 2006 that number had increased 37% to 19403. By 2018, Asian students earned a total of 19403 bachelor’s degrees from the UC, an increase of 85% since 1999.
In 1999, a total of 12,922 Whites earned bachelor’s degrees; in 2006 that number had increased 17% to 15127. By 2018, White students earned a total of 13584 bachelor’s degrees from the UC, a decrease of 11% since 2007, and a net increase of 5% since 1999.
Since 1998, the number of underrepresented students applying, being accepted, enrolling, and eventually graduating from the UC have all steadily increased. To some extent, these increases are consistent with demographic changes among California high school graduates. Between 1996 and 2005, students from underrepresented groups grew from 38.7% to 44.8% of the state’s graduating public high school seniors, while by 2016-2017 students from underrepresented groups made up 56.9% of the state’s graduating public high school seniors.8
In 2011, blacks and Hispanics together constituted 25.2% of the 53,297 UC freshmen and transfers; in 2019, they represented 29.5% of the 66,807 new enrollees. Asians were 35.7% of new enrollees in 2011; in 2019 they were 32.6%.9 In other words, in 2011 and 2019 non-white ethnic minorities constituted more than 60% of all freshmen and transfers at the University of California. When a September 2007 report issued by the UC Undergraduate Work Team of the Study Group on University Diversity constantly advocated the need for a “solution to UC’s diversity ‘problem,’” one wondered what that “problem” actually was.10 The thirteen years since that report’s publication continue to demonstrate that UC has no diversity “problem.”
African American |
1998 | 2006 | 2011 | 2015 | 2019 |
| Freshman Admits | 1,368 | 2,326 | 3,059 | 3,369 | 4,406 |
| Transfer Admits | 312 | 624 | 800 | 918 | 1363 |
| Freshmen Enrolled | 739 | 1,072 | 1,342 | 1,466 | 1,778 |
| Transfer Enrolled | 219 | 415 | 569 | 668 | 960 |
| Total New Enrollees** | 958 | 1487 | 1911 | 2134 | 2738 |
| Increase '98-'19 | 185% | ||||
| Chicano/Latino | 1998 | 2006 | 2011 | 2015 | 2019 |
| Freshman Admits | 5,503 | 11,196 | 16,696 | 19,340 | 26,247 |
| Transfer Admits | 1562 | 2885 | 4390 | 5057 | 7554 |
| Freshmen Enrolled | 2948 | 5,481 | 8,389 | 9,992 | 11,695 |
| Transfer Enrolled | 1132 | 1949 | 3135 | 3642 | 5265 |
| Total New Enrollees** | 4080 | 7430 | 11524 | 13634 | 16960 |
| Increase '98-'19 | 315% | ||||
| Asian | 1998 | 2006 | 2011 | 2015 | 2019 |
| Freshman Admits | 10,427 | 17,035 | 25,439 | 27,976 | 32,826 |
| Transfer Admits | 2,378 | 3,708 | 6261 | 5823 | 7195 |
| Freshmen Enrolled | 6,979 | 11,334 | 14,188 | 14,502 | 16,362 |
| Transfer Enrolled | 1,794 | 2,776 | 4847 | 4474 | 5440 |
| Total New Enrollees** | 8773 | 14110 | 19035 | 18976 | 21802 |
| Increase '98-'19 | 148% | ||||
| White | 1998 | 2006 | 2011 | 2015 | 2019 |
| Freshman Admits | 15,201 | 22,471 | 22,952 | 22,134 | 22,469 |
| Transfer Admits | 4,932 | 7,268 | 8050 | 6708 | 7737 |
| Freshmen Enrolled | 8,257 | 10,687 | 9,274 | 8,719 | 8,867 |
| Transfer Enrolled | 3,674 | 5,218 | 6050 | 5109 | 5711 |
| Total New Enrollees** | 11931 | 15905 | 15324 | 13828 | 14578 |
| Increase '98-'19 | 22% |
**This figure does not include continuing undergraduates
| 1998 | 2006 | 2011 | 2015 | 2019 | Increase, '98-'19 | |
| Black & Hispanic | 5,038 | 8,917 | 13435 | 15768 | 19698 | 291% |
| Asian | 8,773 | 14,110 | 19035 | 18976 | 21802 | 149% |
| White | 11,931 | 15,906 | 15324 | 13828 | 14578 | 22% |
| Total | 25,742 | 38,933 | 47794 | 48572 | 56078 | 117% |
As for gender, in Fall 2019, 54% of all UC undergraduates were women and 45% were men.13
A persistent goal of the UC is to have underrepresented ethnic minorities (blacks, Hispanics, and Native Americans) eventually enroll in numbers that “reflect” or “encompass” or are “approximately proportionate” to their share of the state’s graduating high school seniors.14 Whether those students arrive prepared for intellectual challenges and how soon, if ever, they actually graduate seems less important than increasing their admission numbers. But while lowering admissions standards does no one any favors, UC remains committed to an array of efforts to “repair the K–12 pipeline,” also known as the “hemorrhaging K–12 pipeline.”15
Faculty at the University of California, 1996–2019
This section summarizes faculty hiring trends at the UC over the past 24 years. The official criteria for appointment are stipulated in the Academic Personnel Manual (APM). Every department is bound to judge promise or accomplishment in both teaching and research according to these published criteria. The APM explicitly reminds committees to take exceptional care never to relax its high standards, warning that “superior intellectual attainment, as evidenced both in teaching and in research or other creative achievements, is an indispensable qualification for appointment” (emphasis in original).16
As indicated in Table 5, in 1997–98, the UC appointed 364 new faculty members, of whom 249 (68%) were men and 115 (32%) were women. Between 1999 and 2002 that number for women dipped slightly to around 30%. From 2002 to 2006, however, the annual percentage of all appointments that were women remained consistently at 35%. During those same years, the annual percentage of non-tenured appointments that were women remained at 40%.
| 1996/1997 | 1997/1998 | 1998/1999 | 1999/2000 | 2000/2001 | 2001/2002 | 2002/2003 | 2003/2004 | 2004/2005 | 2005/2006 | All Years | |
| Men | 276 | 249 | 264 | 277 | 320 | 338 | 330 | 376 | 351 | 285 | 3066 |
| Women | 100 | 115 | 98 | 92 | 140 | 154 | 189 | 215 | 191 | 157 | 1451 |
| Men | 73% | 68% | 73% | 75% | 70% | 69% | 64% | 64% | 65% | 64% | 68% |
| Women | 27% | 32% | 27% | 25% | 30% | 31% | 36% | 36% | 35% | 36% | 32% |
The UC webpage containing equivalent data after 2006 was not available to the public at the time this updated article was written.
As indicated in Table 6, the UC steadily increased the numbers of females among its tenured and tenure-track faculty positions by over 30% from 1996 to 2002 without apparently resorting to any programs that violated Proposition 209.
| 1996 | 1997 | 1998 | 1999 | 2000 | 2001 | 2002 | 2003 | 2004 | 2005 | 2006 | Increase, 96-06 | |
| Men | 5397 | 5507 | 5659 | 5743 | 5698 | 5946 | 6032 | 6125 | 6163 | 6150 | 6140 | 13% |
| Women | 1619 | 1699 | 1753 | 1769 | 1812 | 1920 | 2009 | 2136 | 2281 | 2308 | 2379 | 47% |
| Men | 77% | 76% | 76% | 76% | 75% | 75% | 74% | 73% | 72% | 72% | 72% | |
| Women | 23% | 24% | 24% | 24% | 25% | 25% | 26% | 27% | 28% | 28% | 28% |
The same steady increase in the proportion of women among the faculty as a whole, and within the smaller subset of Ladder-rank and Equivalent faculty, has continued between 2009 and 2019.
| 2009 | 2010 | 2011 | 2012 | 2013 | 2014 | 2015 | 2016 | 2017 | 2018 | 2019 | |
| Men | 62.4% | 63.8% | 63.2% | 62.8% | 62.1% | 61.4% | 61.0% | 60.0% | 59.1% | 5830.0% | 57.5% |
| Women | 35.8% | 36.2% | 36.8% | 37.2% | 37.9% | 38.6% | 39.0% | 40.0% | 40.9% | 41.7% | 42.3% |
| 2009 | 2010 | 2011 | 2012 | 2013 | 2014 | 2015 | 2016 | 2017 | 2018 | 2019 | |
| Men | 70.8% | 70.5% | 70.1% | 69.8% | 69.2% | 68.6% | 68.1% | 67.3% | 66.5% | 65.9% | 65.1% |
| Women | 29.2% | 29.5% | 29.9% | 30.2% | 30.8% | 31.4% | 31.9% | 32.7% | 33.5% | 34.1% | 34.9% |
The same applies to ethnic minorities, as shown in Tables 9-11. Between 1996 and 2006 the percentage of full-time faculty who were ethnic minorities grew from 17.5% to 22% of the total faculty, refuting the misleading claim that “the diversity of the UC faculty has remained flat.”21 In 1996, over 82% of the entire UC faculty was listed as “white.” Ten years later, that percentage had declined to 78%. Chicano/Latino faculty grew from 313 in 1996 to 438 in 2006, a 40% increase.
| 1996 | 1997 | 1998 | 1999 | 2000 | 2001 | 2002 | 2003 | 2004 | 2005 | 2006 | Increase, 96-06 | |
| American Indian | 21 | 25 | 24 | 21 | 25 | 31 | 29 | 31 | 35 | 38 | 35 | 66% |
| African American | 186 | 184 | 183 | 176 | 184 | 193 | 183 | 195 | 207 | 211 | 205 | 10% |
| Chicano/Latino | 313 | 318 | 332 | 331 | 347 | 366 | 371 | 382 | 416 | 424 | 438 | 40% |
| Asian | 709 | 756 | 775 | 819 | 825 | 909 | 967 | 1038 | 1107 | 1136 | 1188 | 67% |
| White | 5787 | 5923 | 6098 | 6165 | 6129 | 6367 | 6491 | 6615 | 6679 | 6649 | 6653 | 15% |
The same steady increase in the proportion of faculty from ethnic minorities continued between 2009 and 2019.
| 2009 | 2010 | 2011 | 2012 | 2013 | 2014 | 2015 | 2016 | 2017 | 2018 | 2019 | |
| American Indian | 0.4% | 0.4% | 0.5% | 0.4% | 0.4% | 0.4% | 0.5% | 0.4% | 0.4% | 0.4% | 0.3% |
| Black/African/African American | 2.0% | 2.0% | 2.1% | 2.1% | 2.1% | 2.1% | 2.2% | 2.4% | 2.4% | 2.4% | 2.7% |
| Hispanic/Latino | 5.1% | 5.2% | 5.3% | 5.5% | 5.6% | 5.8% | 6.1% | 6.4% | 6.5% | 6.5% | 6.7% |
| Asian | 16.9% | 17.1% | 17.8% | 18.3% | 18.8% | 19.1% | 19.4% | 19.9% | 20.4% | 20.6% | 21.4% |
| White | 72.1% | 71.3% | 71.3% | 70.3% | 69.0% | 68.1% | 67.2% | 65.7% | 64.6% | 62.8% | 62.3% |
| Two or More Races | 0.0% | 0.0% | 0.0% | 0.0% | 0.2% | 0.0% | 0.4% | 0.5% | 0.5% | 0.7% | 0.8% |
| Unknown | 3.1% | 3.5% | 3.3% | 3.0% | 3.4% | 3.5% | 3.7% | 4.3% | 4.7% | 6.0% | 5.2% |
| 2009 | 2010 | 2011 | 2012 | 2013 | 2014 | 2015 | 2016 | 2017 | 2018 | 2019 | |
| American Indian | 0.4% | 0.4% | 0.4% | 0.4% | 0.5% | 0.5% | 0.5% | 0.5% | 0.5% | 0.5% | 0.5% |
| Black/African/African American | 2.1% | 2.1% | 2.2% | 2.2% | 2.1% | 2.2% | 2.3% | 2.5% | 2.5% | 2.5% | 2.8% |
| Hispanic/Latino | 5.3% | 5.3% | 5.5% | 5.8% | 6.0% | 6.1% | 6.3% | 6.7% | 6.8% | 7.0% | 7.2% |
| Asian | 14.2% | 14.3% | 14.8% | 15.2% | 15.7% | 15.9% | 15.9% | 16.3% | 16.8% | 17.1% | 17.9% |
| White | 75.8% | 75.1% | 74.6% | 74.2% | 72.9% | 72.1% | 71.3% | 69.9% | 68.6% | 67.3% | 66.8% |
| Two or More Races | 0.0% | 0.0% | 0.0% | 0.0% | 0.0% | 0.3% | 0.4% | 0.4% | 0.5% | 0.6% | 0.7% |
| Unknown | 1.8% | 2.3% | 2.0% | 1.9% | 2.2% | 2.4% | 2.8% | 3.2% | 3.6% | 4.5% | 3.4% |
The UC continues to fill faculty openings with a broad range of talented women and ethnic minority candidates who, the available evidence confirms, obtain university employment apparently without resort to policies that violate Proposition 209.
California State University System Baccalaureates
Opponents of Proposition 209 frequently dwelled on the comparably small overall admissions numbers of blacks and Hispanics at UCLA and Berkeley—the two most competitive campuses of the entire UC system—but ignored the fact that the CSU is also a crucial part of California’s accessible public university system.25 The undergraduate enrollment figures for the CSU system between 1995 and 2018 provide instructive data on admissions, retention, and graduation numbers by race, gender, and ethnicity.
As shown in Table 12, the number of ethnic minorities admitted and enrolled has increased steadily between 1998 and 2018.
| African American | 1998 | 2006 | 2011 | 2015 | 2018 |
| Freshman Admits | 3,950 | 6,804 | 5,849 | 6,304 | 6,943 |
| Transfer Admits | 2703 | 4764 | 4072 | 4213 | 4102 |
| Freshmen Enrolled | 2264 | 3,817 | 2,968 | 2,840 | 2,777 |
| Transfer Enrolled | 2105 | 2929 | 2290 | 2457 | 2318 |
| Total New Enrollees** | 4369 | 6746 | 5258 | 5297 | 5095 |
| Increase '98-'18 | 16% | ||||
| Mexican American/Other Latino | 1998 | 2006 | 2011 | 2015 | 2018 |
| Freshman Admits | 13,446 | 26,021 | 44,422 | 61,681 | 74,620 |
| Transfer Admits | 10361 | 18960 | 24835 | 34417 | 42442 |
| Freshmen Enrolled | 7574 | 13,727 | 21,791 | 29,306 | 31,756 |
| Transfer Enrolled | 8201 | 12722 | 15519 | 21824 | 26633 |
| Total New Enrollees** | 15775 | 26449 | 37310 | 51130 | 58389 |
| Increase '98-'18 | 270% | ||||
| Asian | 1998 | 2006 | 2011 | 2015 | 2018 |
| Freshman Admits | 9,044 | 15,906 | 17,270 | 20,368 | 25,669 |
| Transfer Admits | 7,486 | 10,162 | 10615 | 10673 | 11086 |
| Freshmen Enrolled | 4,642 | 6,137 | 7,016 | 7,497 | 7,783 |
| Transfer Enrolled | 5,989 | 6,688 | 6293 | 6607 | 6455 |
| Total New Enrollees** | 10631 | 12825 | 13309 | 14104 | 14238 |
| Increase '98-'18 | 34% | ||||
| White | 1998 | 2006 | 2011 | 2015 | 2018 |
| Freshman Admits | 22,535 | 36,559 | 36,023 | 35,713 | 39,117 |
| Transfer Admits | 22,685 | 28,655 | 25834 | 23728 | 23778 |
| Freshmen Enrolled | 12,137 | 18,391 | 15,900 | 14,282 | 13,597 |
| Transfer Enrolled | 18,375 | 20,276 | 16726 | 15515 | 14677 |
| Total New Enrollees** | 30512 | 38667 | 32626 | 29797 | 28274 |
| Increase '98-'18 | -7% |
**This figure does not include continuing undergraduates.
As shown in Table 13, over the twelve years between 1995-96 and 2006-07, bachelor’s degrees annually awarded to black undergraduates in the CSU system increased 42%, from 2,419 in 1995–96 to 3,440 in 2006–07. The degrees awarded to Hispanic students dramatically jumped 95%, from 7,425 in 1995–96 to 14,483 in 2006–07. For the CSU system as a whole, the number of all baccalaureate degrees grew 34% between 1995–96 and 2006–07, from 52,730 to 70,887. In fact, ethnic minorities accounted for 34% of all degree earners in 1995–96, and by 2006–07 they earned 42% of all CSU baccalaureate degrees, a 23% jump in twelve years.
| Total CSU Degrees | Black | Hispanic* | Asian | White | Filipino | Unknown | |
| 1995-96 | 52730 | 2419 | 7425 | 6665 | 26875 | 1771 | 5202 |
| 100% | 4.5% | 14.0% | 12.6% | 50.9% | 3.3% | 9.9% | |
| 2000-01 | 56983 | 2717 | 10346 | 7417 | 24217 | 2356 | 6917 |
| 100% | 4.8% | 18.1% | 13.0% | 42.5% | 4.1% | 12.1% | |
| 2005-06 | 69350 | 3317 | 13877 | 8701 | 27387 | 2837 | 9482 |
| 100% | 4.8% | 20.1% | 12.5% | 39.5% | 4.1% | 13.7% | |
| 2006-07 | 70887 | 3440 | 14483 | 8910 | 28039 | 2745 | 9404 |
| 100% | 4.9% | 20.4% | 12.6% | 39.6% | 3.9% | 13.9% | |
| Increase, ’95-’96-’06-’07 | 34.4% | 42.0% | 95.0% | 33.6% | 4.3% | 55.0% | 80.0% |
*CSU tabulations list separate figures for “Mexican-American” and “Other Hispanic.” This table combines those two categories into one, “Hispanic.”
As shown in Table 14, ethnic minorities continued to receive ever larger proportions of CSU baccalaureate degrees between 2006-07 and 2018-19.
| Total CSU Degrees | Black | Hispanic* | Asian | White | Filipino | Unknown | |
| 2006-07 | 70887 | 3440 | 14483 | 8910 | 28039 | 2745 | 9404 |
| 100% | 4.9% | 20.4% | 12.6% | 39.6% | 3.9% | 13.9% | |
| 2010-11 | 76509 | 3381 | 17706 | 9484 | 29422 | 3148 | 9342 |
| 100% | 4.4% | 23.1% | 12.4% | 38.5% | 4.1% | 12.2% | |
| 2014-15 | 83185 | 3460 | 26637 | 10780 | 28380 | 3535 | 6418 |
| 100% | 4.2% | 32.0% | 13.0% | 34.1% | 4.2% | 7.7% | |
| 2018-19 | 102333 | 3858 | 41,728 | 13042 | 27293 | 4536 | 5674 |
| 100% | 3.8% | 40.8 | 12.7% | 26.7% | 4.4% | 5.5% | |
| Increase, ’06-’07-’18-’19 | 44.4% | 12.2% | 188.1% | 46.4% | -2.7% | 65.2% | -39.7% |
*CSU tabulations list separate figures for “Mexican-American” and “Other Latino.” This table combines those two categories into one, “Hispanic.”
When considered in conjunction with the data on the UC over the same period, these statistics refute exaggerations that Proposition 209 would reduce the number of black or Hispanic students enrolled in or graduating from California’s four-year public university system. A slight redistribution of students certainly resulted from the prohibition of racial or ethnic double standards in university admissions, but the overall result was a steady increase in minority graduation rates in both the UC and the CSU systems.
California State University Faculty
The employment of women and ethnic minorities as faculty steadily increased in the CSU system. The annual percentage of new CSU faculty hires that are female has grown from 31% in 1985 to 42% in 2003 to almost 50% in 2006.29 The annual increases for African American faculty members also continued, growing from 3% in 2000 to 4.5% in 2003 to almost 5% in 2006. There has been no deterioration in the faculty positions of African Americans or women as predicted by opponents of Proposition 209.
From 1998 to 2005, the percentage of full-time tenured faculty at CSU who were ethnic minorities rose from 21% to 26.5%. Correspondingly, the number of new tenure-track hires from underrepresented minority groups steadily increased almost every year from 1998 to 2008, as indicated in Table 15.
| 1998 & 1999 | 2000 | 2001 | 2002 | 2003 | 2004 | 2005 | 2006 | 2007 | 2008 | |
| Appointments | 1159 | 704 | 845 | 950 | 817 | 393 | 720 | 882 | 852 | 672 |
| White | 72.9% | 71.8% | 69.8% | 63.5% | 62.2% | 59.5% | 58.9% | 58.1% | 61.0% | 59.5% |
| African American | 4.2% | 3.0% | 4.4% | 3.8% | 4.5% | 3.8% | 4.0% | 4.8% | -- | -- |
| Hispanic | 8.6% | 9.8% | 10.5% | 8.5% | 8.1% | 10.2% | 7.6% | 6.9% | -- | -- |
| Asian | 13.8% | 14.7% | 15.0% | 15.4% | 14.3% | 18.3% | 15.6% | 18.3% | -- | -- |
| White Males | 35.0% | 37.0% | 36.9% | 36.0% | 33.8% | 28.5% | 30.8% | 30.0% | 31.2% | 30.2% |
| Minority Males | 14.0% | 15.0% | 14.8% | 16.0% | 14.3% | 17.0% | 13.6% | 13.7% | 15.4% | 16.4% |
| White Females | 38.0% | 35.0% | 30.1% | 27.0% | 28.4% | 31.0% | 28.1% | 28.1% | 29.8% | 29.3% |
| Minority Females | 13.0% | 13.0% | 15.4% | 12.0% | 14.2% | 16.0% | 14.3% | 16.6% | 15.3% | 16.1% |
| Unknown | 0.0% | 0.0% | 2.8% | 8.2% | 9.0% | 7.4% | 13.2% | 11.6% | 8.3% | 8.0% |
CSU continued to hire substantial proportions of ethnic minorities each year between 2009 and 2015.
| 2009 | 2010 | 2011 | 2012 | 2013 | 2014 | 2015 | |
| Appointments | 359 | 108 | 453 | 382 | 470 | 742 | 849 |
| American Indian/Alaska Native | 0.6% | 2.8% | 1.3% | 1.3% | 1.3% | 1.2% | 0.7% |
| Asian | 24.0% | 21.3% | 21.2% | 18.8% | 22.1% | 18.5% | 20.5% |
| African American | 3.4% | 5.6% | 3.8% | 3.9% | 4.9% | 4.6% | 4.2% |
| Hispanic | 8.9% | 6.5% | 9.7% | 6.8% | 8.5% | 8.5% | 11.1% |
| Native Hawaiian/Pacific Islander | 0.0% | 0.0% | 0.7% | 0.3% | 0.0% | 0.4% | 0.1 |
| White | 53.2% | 50.0% | 54.7% | 61.3% | 57.9% | 56.5% | 56.3% |
| Two or More Races | 1.1% | 0.0% | 2.6% | 0.8% | 1.9% | 1.5% | 1.9% |
| Other Unknown | 8.9% | 13.9% | 6.0% | 6.8% | 3.4% | 8.9% | 5.2% |
| 1998 & 1999 | 2000 | 2001 | 2002 | 2003 | 2004 | 2005 | |
| White | 79.0% | 78.1% | 77.2% | 76.7% | 75.7% | 74.6% | 73.5% |
| African American | 3.7% | 3.8% | 4.0% | 4.0% | 4.0% | 3.9% | 4.0% |
| Hispanic | 5.8% | 6.1% | 6.4% | 6.7% | 7.0% | 7.4% | 7.6% |
| Asian | 11.0% | 11.4% | 11.8% | 12.0% | 12.6% | 12.7% | 13.2% |
| 2005 | 2010 | 2015 | |
| American Indian or Alaska Native | 0.6% | 0.6% | 0.7% |
| Asian | 13.4% | 15.8% | 18.0% |
| Black/African American | 3.9% | 4.1% | 3.6% |
| Hispanic/Latino | 7.9% | 8.5% | 9.0% |
| Native Hawaiian/Pacific Islander | 0.2% | 0.1% | 0.1% |
| White | 71.9% | 67.3% | 63.0% |
| Two or More Races | n/a | 0.5% | 0.7% |
| Other/Unknown | 2.2% | 3.0% | 4.8% |
| 2014 | % | 2019 | % | |
| Total | 7207 | 6944 | ||
| American Indian or Alaska Native | 39 | 0.5% | 36 | 0.5% |
| Asian | 1203 | 16.7% | 1402 | 20.2% |
| Black/African American | 257 | 3.6% | 241 | 3.5% |
| Hispanic/Latino | 639 | 8.9% | 641 | 9.2% |
| Native Hawaiian/Pacific Islander | 10 | 0.1% | 8 | 0.1% |
| White | 4762 | 66.1% | 4289 | 61.8% |
| Two or More Races | 50 | 0.7% | 62 | 0.9% |
| Other/Unknown | 220 | 3.1% | 265 | 3.8% |
While the CSU system generally seems to remain in compliance with Proposition 209, one still encounters suspicious language, such as the following from 2007 and 2008 faculty search announcements at CSU, Chico: “As a University that educates students of various ethnic and cultural backgrounds, we value a diverse faculty and staff. The campus welcomes applicants who are knowledgeable about and interested in working within a cross-cultural learning environment.”35
Like the UC, the CSU system continues to fill faculty openings with a broad range of talented women and ethnic minority candidates who apparently obtain university employment without resort to policies that violate Proposition 209. The dreadful predictions propagated by many academics and university administrators in Michigan who opposed Proposal 2 in 2006 have never materialized in either of California’s four-year public higher education systems. However, efforts to avoid or neutralize the measure may continue; no official from either system has ever publicly avowed to uphold the letter and spirit of Proposition 209 and punish any employee or committee members who violated it.36
The Effects of Proposition 209 on Construction Contracting
Prior to the passage of Proposition 209, a California statute mandated that general contractors demonstrate a good faith effort to subcontract at least 5% of their work on public contracts to women business enterprises (WBE), 15% to minority business enterprises (MBE), and 3% to disabled veteran-owned businesses.37
Moreover, bids submitted by MBEs and WBEs were granted a 10% reduction when measured against bids from companies owned by white men. Prime contractors who bid on certain types of contracts were required to demonstrate that they had hired a certain percentage of MBE and WBE subcontractors to work on the project or show that they made good faith efforts to meet that quota.
Since the passage of Proposition 209, the California Supreme Court has struck down attempts by municipalities to consider race or gender in their procurement programs.38 With race or gender preferences no longer in effect, the number of MBEs and WBEs certified to bid on public contracts declinedin the decade after Proposition 2009 passed. The number of MBEs declined from 3269 to 1005 and the number of WBEs declined from 2096 to 763.39 Opponents of Proposition 209 insist that this amounts to “unfair access” and is due to continued discrimination within the construction industry—casually termed a “good old boys network”—and that only the use of gender-conscious or race-attentive measures will provide a remedy.
However, no one has demonstrated that racial, ethnic, or gender discrimination has actually occurred against MBEs or WBEs. A simple disparity does not prove discrimination, and no “group” is ever likely to own any particular kind of business in the same proportion as its share of the state’s population. Moreover, “it may be that companies owned by a particular racial group in a particular market do not have the specific expertise or capability of doing the actual work sought. And even if there are, there may not be a problem if these companies are, for non-discriminatory reasons, not submitting bids in the first place.”40
There is abundant evidence to support this sensible conclusion. Two of the best compilations of anecdotal material, statistical data, and personal interviews on the effects of Proposition 209 on public contracting derive from compelling studies made by the Discrimination Research Center at UC Berkeley and its successor, the Thelton E. Henderson Center for Social Justice, ironically strong opponents of Proposition 209.41
Throughout the two studies, interviewees from contracting firms still in existence cited their bids, not the race or gender of the company’s owners, as the main reason for their selection. In summarizing these two reports, one must bear in mind that the “underrepresentation of firms owned by this or that ethnic group traceable only to society generally…cannot as a legal matter justify the use of racial preferences, as the Supreme Court has consistently ruled….[W]hat must be shown is that minority- and female-owned firms are either not submitting bids because of discrimination, or that their bids are not being accepted because of discrimination.”42
Neither study in California found evidence that companies had been excluded from bidding because of the bidder’s race or gender or due to any unrealistic or irrational requirements. In its reliance on statistical data, focus group responses, and interviews the two reports strongly suggest that it was not discrimination that posed the main obstacles to minority-owned businesses, but more technical barriers such as bonding requirements, insurance, and financing, along with business acumen.
Of the 3269 MBEs certified in 1996, 1005 remained in operation ten years later. In its survey of these surviving companies, the Discrimination Research Center report, entitled Free to Compete? Measuring the Impact of Proposition 209 on Minority Business Enterprises, documents that few “respondents participated in any lending programs, mentorship opportunities, or technical assistance, regardless of whether or not the opportunities were affiliated with the CalTrans DBE Program.”43 Some participants acknowledged that “private industry was more inclined to work with firms that have the ability to work regionally or nationally, which is beyond the capacity of many MBEs” (35).
This makes efficient business sense and is not evidence of racial discrimination.
Free to Compete? contains candid admissions from participants who “noted that DBE programs incorporated a significant amount of ‘hand holding,’ which did not encourage MBE owners to learn the business aspects of their industry…[and] participants agreed that they should be evaluated not by whether they are people of color, but rather, on the merit of their skill, work, and reputation” (35–36, emphasis added).
According to owners of surviving firms, “a lack of business savvy on the part of many MBEs contributed to their failure” (36), a likely result if race-consciousness counted more for success than business acumen. When asked which survival strategies were most effective, the respondents advised that “firms owned by people of color need to utilize basic business development practices to invest in their own companies,” that their “owners must be persistent” and “seek every opportunity to demonstrate their ability to perform well and commit themselves to developing relationships with individual companies and public agencies” (37)—sensible values and indisputable entrepreneurial habits, regardless of one’s gender or race.
The final pages of Free to Compete? contain profiles of two successful businessmen: Miguel Galarza (a Hispanic man) and Robert Wilson (a black man). Galarza admitted that he was “uncomfortable with the business model of relying on the DBE program to provide contracts that would sustain his business.” He also “understood that the federal DBE program was designed to open the door for MBEs and that they should serve as training wheels, not permanent fixtures to sustain the life of a business enterprise” (38). Galarza emphasized that sound business principles such as “leave the profit in the company instead of using it as a personal profit,” “learn accounting and always pay your taxes on time,” and “bid as a primary contractor” all became part of his organizational mantra (39).
By 2006, Galarza’s company employed thirty people and earned over $7 million in revenue. The report concludes that for Galarza, “the impact of Proposition 209 was more visible among those who would have been his competitors—those who, in their reliance on the race-conscious DBE program, may not have been able to survive in an industry run on personal relationships” (39, emphasis added).
On the other hand, Robert Wilson admits his company initially declined for a few years, but by 2004 he reversed its slide by “moving from industrial electric projects to residential projects” (41). According to the report, Wilson “attributes the survival of his business to his belief in God, his knowledge of the trade, his ability to be flexible, and his ability to live with minimal resources” (41). Wilson makes no mention of his race.
Free to Compete? concludes that Wilson learned “as a result of Proposition 209, that ‘business has no color.’ From his experience of success, loss, and rebuilding, [he] has identified stumbling blocks and shown a way to break down the financial barriers that keep MBEs from succeeding as public contractors, and established himself as a survivor, in more ways than one” (41).
Free to Compete? indicates that double standards had been used in the construction industry and shows that the firms that continued to thrive and grow over the past ten years shared several things in common. Its central finding was that many of the firms that went out of business were simply under-financed and poorly run. The purported presence of racial or gender discrimination was never shown to be the basis for weaker performance.
In the case of WBEs in the construction industry, A Vision Fulfilled? The Impact of Proposition 209 on Equal Opportunity for Women Business Enterprises, a report produced by the Thelton E. Henderson Center for Social Justice at the UC Berkeley School of Law, showed that for most women in business, limited experience in borrowing, difficulties in demonstrating overall creditworthiness, lower rates of homeownership, and poor capital resources were the key factors that limited their access to financial resources.
Owners of successful WBEs attributed their longevity to maintaining connections with civic, professional, and social organizations or networks that involved potential clients or contracts, and shifting their focus from public agencies to private sector or nonprofit organizations. The surviving companies were led by women who possessed the same tenacity, consistency, and shrewd business sense shown by men and who spent time and money to respond only to “Request for Proposals” “that perfectly match their expertise and that are received in a timely fashion.”44 There was no evidence that any contractor’s low bid was rejected because a woman or an ethnic minority member submitted it.
According to Sharon Browne, the lead attorney in the Hi-Voltage Wire Works case,45 “Proposition 209 presents zero tolerance for programs that discriminate against or grant preference on the basis of race in its public contracting program.”46 Nevertheless, to this day, opponents of Proposition 209 disdain its terminology and refer euphemistically to preferential practices as “race- and gender-conscious equal opportunity programs.”
A study by political scientist George La Noue shows how the California Supreme Court’s Hi-Voltage decision interpreted Proposition 209 “to bar flatly racial preferences, no matter what compelling interest a jurisdiction asserted. Disparity studies are no longer much of a factor in California as related to state funded contracts.”47
Nonetheless, in August 2007, the California Department of Transportation (Caltrans) submitted a new request to the federal government that it be allowed to institute a 13.5% participation goal for minority- and women-owned businesses in contracting as a response to what Caltrans termed a “discriminatory pattern in past contracting.”48
Research by economist Justin Marion of UC Santa Cruz suggests that such affirmative action programs were not cost-effective. In the wake of Proposition 209, Marion found that “the winning bid on state-funded contracts fell by between 3.1 and 5.6 percent relative to similar federal-aid contracts.”49
In 1996, Caltrans awarded $1.4 billion in contracts, of which $50 million (3.5%) went to women-owned businesses. Six years later, in 2002, Caltrans awarded $3.4 billion in contracts; women-owned businesses received $117 million (3.4%). Data are not available from 2002 through 2006.
As Roger Clegg has stated succinctly, twelve years after the passage of Proposition 209 “Caltrans should strive both to avoid using the preferences banned by the state constitution and to comply with federal law…[and] should be going out of its way to avoid the use of preferences based on race, ethnicity and sex—not out of its way to find excuses for them.”50
The Effects of Proposition 209 on Statewide California Public Employment
The public employed labor force in California is the largest and most diverse in the United States. There are two broad categories of state employees: those who work for one of the over 150 agencies and departments; and those who work in the two public higher education institutions, the UC and the CSU systems.
Statistics obtained from the State Personnel Board (SPB) indicate the total number of employees in each of the 86 departments with over 50 employees, broken down by gender and race over the past ten years. This report further highlights the departments with more than 3000 employees.
In 2006, California had the third-lowest number of full-time equivalent state employees relative to population: 105 state employees for every 10,000 residents, whereas the national average was 142 state employees per 10,000 residents. Tables 20, 21, and 22 lists the number of employees in the largest state agencies, comparing a breakdown by race and gender for 1997, 2002, 2006, 2009/2010, 2014, and 2018, as well as by race and gender for several of the largest categories of public employment.
| Statewide Total | Total | Male | Female | White | Black | Hispanic |
| 1997 | 190676 | 52% | 48% | 57% | 11% | 18% |
| 2002 | 218208 | 52% | 48% | 53% | 11% | 19% |
| 2006 | 209818 | 53% | 47% | 50% | 11% | 21% |
| 2010 | 216893 | 53% | 47% | 48% | 11% | 22% |
| 2014 | 210559 | 54% | 46% | 46% | 10% | 23% |
| 2018 | 216910 | 54% | 46% | 43% | 10% | 25% |
| Compensation Insurance Fund | Total | Male | Female | White | Black | Hispanic |
| 1997 | 5991 | 30% | 70% | 46% | 11% | 18% |
| 2002 | 8174 | 30% | 70% | 42% | 10% | 20% |
| 2006 | 9449 | 32% | 68% | 40% | 10% | 20% |
| 2009/2010 | 4279 | 33% | 67% | 41% | 9% | 18% |
| 2014 | 4096 | 34% | 66% | 40% | 9% | 20% |
| 2018 | 4182 | 35% | 65% | 38% | 9% | 21% |
| Consumer Affairs | Total | Male | Female | White | Black | Hispanic |
| 1997 | 4708 | 45% | 55% | 68% | 7% | 12% |
| 2002 | 4738 | 36% | 64% | 63% | 10% | 15% |
| 2006 | 3720 | 38% | 62% | 60% | 12% | 16% |
| 2009/2010 | 3569 | 39% | 61% | 58% | 12% | 17% |
| 2014 | 3950 | 40% | 60% | 52% | 13% | 19% |
| 2018 | 3498 | 42% | 58% | 49% | 12% | 21% |
| Corrections and Rehabilitation | Total | Male | Female | White | Black | Hispanic |
| 1997 | 40916 | 67% | 33% | 55% | 15% | 22% |
| 2002 | 45951 | 67% | 33% | 53% | 13% | 26% |
| 2006 | 49919 | 66% | 34% | 49% | 13% | 28% |
| 2009/2010 | 60426 | 63% | 37% | 46% | 12% | 30% |
| 2014 | 53602 | 63% | 37% | 43% | 12% | 33% |
| 2018 | 59298 | 62% | 38% | 38% | 10% | 36% |
| Developmental Services | Total | Male | Female | White | Black | Hispanic |
| 1997 | 7689 | 36% | 64% | 54% | 10% | 15% |
| 2002 | 9767 | 35% | 65% | 44% | 11% | 18% |
| 2006 | 8285 | 37% | 63% | 40% | 11% | 19% |
| 2009/2010 | 6180 | 39% | 61% | 40% | 10% | 24% |
| 2014 | 4005 | 39% | 61% | 38% | 7% | 24% |
| 2018 | 2560 | 42% | 58% | 36% | 7% | 34% |
| Employment Development | Total | Male | Female | White | Black | Hispanic |
| 2009/2010 | 9912 | 36% | 64% | 33% | 16% | 28% |
| 2014 | 7777 | 34% | 66% | 29% | 16% | 29% |
| 2018 | 7119 | 36% | 64% | 26% | 15% | 30% |
| Equalization | Total | Male | Female | White | Black | Hispanic |
| 2009/2010 | 3859 | 38% | 62% | 42% | 10% | 20% |
| 2014 | 4647 | 40% | 60% | 39% | 10% | 22% |
| Forestry and Fire Protection | Total | Male | Female | White | Black | Hispanic |
| 1997 | 5511 | 80% | 20% | 75% | 3% | 14% |
| 2002 | 5921 | 82% | 18% | 75% | 3% | 14% |
| 2006 | 6003 | 83% | 17% | 75% | 2% | 15% |
| 2009/2010 | 7435 | 85% | 15% | 76% | 2% | 15% |
| 2014 | 6905 | 87% | 13% | 76% | 2% | 16% |
| 2018 | 5957 | 85% | 15% | 73% | 2% | 16% |
| Franchise Tax Board | Total | Male | Female | White | Black | Hispanic |
| 1997 | 5696 | 31% | 69% | 52% | 13% | 19% |
| 2002 | 7005 | 33% | 67% | 47% | 14% | 19% |
| 2006 | 6602 | 34% | 66% | 44% | 15% | 19% |
| 2009/2010 | 6316 | 36% | 64% | 42% | 14% | 19% |
| 2014 | 6273 | 37% | 63% | 40% | 13% | 19% |
| 2018 | 6164 | 40% | 60% | 37% | 11% | 20% |
| General Services | Total | Male | Female | White | Black | Hispanic |
| 2009/2010 | 4137 | 63% | 37% | 43% | 16% | 21% |
| 2014 | 3438 | 62% | 38% | 40% | 16% | 23% |
| 2018 | 3441 | 62% | 38% | 37% | 16% | 23% |
| Health Care Services | Total | Male | Female | White | Black | Hispanic |
| 2009/2010 | 2648 | 34% | 66% | 42% | 11% | 16% |
| 2014 | 3389 | 36% | 64% | 39% | 11% | 17% |
| 2018 | 3416 | 38% | 62% | 37% | 10% | 16% |
| Highway Patrol | Total | Male | Female | White | Black | Hispanic |
| 1997 | 9756 | 75% | 25% | 72% | 6% | 16% |
| 2002 | 10195 | 75% | 25% | 68% | 6% | 18% |
| 2006 | 9734 | 76% | 24% | 66% | 6% | 20% |
| 2009/2010 | 10928 | 77% | 23% | 65% | 5% | 22% |
| 2014 | 10490 | 78% | 22% | 64% | 5% | 23% |
| 2018 | 10504 | 78% | 22% | 60% | 5% | 26% |
| Justice | Total | Male | Female | White | Black | Hispanic |
| 2009/2010 | 4546 | 39% | 61% | 53% | 9% | 18% |
| 2014 | 4168 | 39% | 61% | 51% | 9% | 18% |
| 2018 | 4494 | 40% | 60% | 48% | 8% | 19% |
| Mental Health | Total | Male | Female | White | Black | Hispanic |
| 1997 | 7270 | 43% | 57% | 57% | 14% | 13% |
| 2002 | 8397 | 41% | 59% | 48% | 15% | 15% |
| 2006 | 9422 | 42% | 58% | 43% | 15% | 17% |
| 2009/2010 | 10,891 | 41% | 59% | 41% | 14% | 18% |
| Motor Vehicles | Total | Male | Female | White | Black | Hispanic |
| 1997 | 8435 | 25% | 75% | 40% | 19% | 26% |
| 2002 | 9238 | 25% | 75% | 35% | 19% | 29% |
| 2006 | 8582 | 27% | 73% | 31% | 20% | 31% |
| 2009/2010 | 8659 | 28% | 72% | 29% | 19% | 33% |
| 2014 | 9182 | 30% | 70% | 27% | 20% | 35% |
| 2018 | 9251 | 30% | 70% | 24% | 18% | 37% |
| Parks and Recreation | Total | Male | Female | White | Black | Hispanic |
| 2009/2010 | 5153 | 59% | 41% | 77% | 2% | 14% |
| 2014 | 4877 | 59% | 41% | 76% | 2% | 14% |
| 2018 | 5266 | 61% | 39% | 73% | 2% | 15% |
| Public Health | Total | Male | Female | White | Black | Hispanic |
| 2009/2010 | 3493 | 33% | 67% | 50% | 12% | 14% |
| 2014 | 3316 | 32% | 68% | 45% | 13% | 14% |
| 2018 | 3723 | 32% | 68% | 40% | 12% | 16% |
| Social Services | Total | Male | Female | White | Black | Hispanic |
| 2009/2010 | 3821 | 26% | 74% | 39% | 16% | 19% |
| 2014 | 3858 | 28% | 72% | 36% | 15% | 20% |
| 2018 | 4217 | 29% | 71% | 36% | 15% | 21% |
| State Hospitals | Total | Male | Female | White | Black | Hispanic |
| 2014 | 11494 | 43% | 57% | 36% | 15% | 20% |
| 2018 | 10583 | 45% | 55% | 33% | 15% | 23% |
| Transportation | Total | Male | Female | White | Black | Hispanic |
| 1997 | 16902 | 75% | 25% | 60% | 8% | 15% |
| 2002 | 23405 | 74% | 26% | 53% | 8% | 15% |
| 2006 | 21419 | 74% | 26% | 50% | 8% | 16% |
| 2009/2010 | 21412 | 74% | 26% | 49% | 8% | 17% |
| 2014 | 19618 | 75% | 25% | 47% | 8% | 18% |
| 2018 | 20503 | 75% | 25% | 42% | 8% | 20% |
| Total | Women | Black | White | Hispanic | ||||||
| 1997 | 2006 | 1997 | 2006 | 1997 | 2006 | 1997 | 2006 | 1997 | 2006 | |
| Education & Library | 3009 | 2627 | 36.0% | 44.0% | 10.2% | 8.9% | 71.7% | 69.9% | 11.3% | 3.5% |
| Fiscal, Management & Staff Services | 34163 | 42982 | 57.0% | 64.0% | 8.7% | 9.9% | 60.8% | 51.7% | 13.2% | 6.6% |
| Mechanical & Construction Trades | 18173 | 14273 | 12.7% | 11.0% | 7.2% | 8.0% | 65.8% | 61.3% | 19.6% | 22.3% |
| Medical and Allied Services | 13888 | 16358 | 61.0% | 64.0% | 11.6% | 12.7% | 55.2% | 40.7% | 11.9% | 14.3% |
| Office and Allied Services | 39304 | 33683 | 85.0% | 82.0% | 15.5% | 16.5% | 48.2% | 39.8% | 21.6% | 25.0% |
| Total Statewide Civil Servants | 191425 | 210591 | 47.2% | 47.2% | 11.5% | 11.1% | 57.5% | 50.5% | 17.7% | 20.9% |
| Statewide Total | Total | Male | Female | White | Black | Hispanic |
| 1997 | 190676 | 52% | 48% | 57% | 11% | 18% |
| 2002 | 218208 | 52% | 48% | 53% | 11% | 19% |
| 2006 | 209818 | 53% | 47% | 50% | 11% | 21% |
| 2010 | 216893 | 53% | 47% | 48% | 11% | 22% |
| 2014 | 210559 | 54% | 46% | 46% | 10% | 23% |
| 2018 | 216910 | 54% | 46% | 43% | 10% | 25% |
Between 1997 and 2006, the size of the California public employees workforce fluctuated in a manner that reflected the overall economic status of the state: from 1997 to 2002, the public workforce grew by 14%; from 2002 to 2006, it contracted by 4%; and with further ups and downs, it increased by a net of 14% between 1997 and 2018, an absolute increase of 26,234. Yet over this 19-year period, whites declined from 57% to 43% of California public employees, blacks declined from 11% to 10%, and Hispanics increased from 18% to 25%. Over this 19-year period, the percentage of public employees who were men inched up 2%, from 52% to 54%.
In every examined state agency, the percentage of white employees declined between 1997 and 2018, sometimes severely. In the Department of Consumer Affairs, for instance, the number of white employees declined from 68% in 1997 to 49% in 2018. A similar decrease occurred in the Franchise Tax Board, where employment of white workers dropped from 52% in 1997 to 37% by 2018. At the Departments of Corrections and Rehabilitation, Motor Vehicles, and Transportation, which together employed 41% of all California public employees in 2018, the number of white employees dropped by 17%, 16%, and 18%, respectively.
For California’s public workforce as a whole, the number of white employees dropped from 57% to 43% between 1997 and 2018.
The gender increases among the state’s public employees slightly favored men, 52% to 54%.
Among the state’s largest agencies, women’s employment at Corrections and Rehabilitation rose from 33% to 38%, fell at Highway patrol from 25% to 22%, rose at Consumer Affairs from 55% to 58%, fell at Motor Vehicles from 75% to 70%, fell at the Franchise Tax Board from 69% to 60%, and at Transportation remained stable at 25%
It appears that these disparities are due to personal choice, assorted risk elements, or physically demanding job requirements, since discrimination or preferences in the workplace based on gender (unless approved as a bona fide criteria for employment) are prohibited.
California Highway Patrol
The California Highway Patrol (CHP) provides several reasons for persistent patterns in the gender distribution in that agency. Aside from non-uniform clerical positions from which people can shift to other state agencies, there are seven categories within which uniformed personnel are classified: cadet, officer, sergeant, lieutenant, captain, assistant chief, and chief. Each category has its own clearly stipulated requirements for inclusion and promotion.
The entry-level CHP position is “cadet.” The age range for cadets is between twenty-one and thirty-five, and applicants must hold a high school diploma. After passing a series of written, physical, and driving tests, all cadets must complete a rigorous twenty-seven-week paramilitary-style training regimen. Even from that entry level, the annual dropout rate is consistently 33%. In discussions with CHP officers, they cited three obstacles that make it difficult to attract more female cadets: 1) the rigors of a live-in academy mean that some women would be separated from their children; 2) cadets are almost always obliged to relocate after graduation from the academy; and 3) the mental and physical demands of the paramilitary training still seem to discourage more women than men.
A review of CHP hiring and promotion figures under Proposition 209 indicates that the overall number of employees increased modestly: 9,756 in 1997 and 10,504 in 2018. The number of employees who were men increased by 3% to constitute 78% of the CHP workforce. The number of Hispanic CHP employees increased from 16% to 26%, while the number of blacks decreased from 6% to 5%, and the number of whites declined from 72% to 60%.
Conclusion
The data in this article confirm that Proposition 209 did not diminish educational or employment opportunities in California, as ethnic minorities and women have continued to make steady progress in both areas. Despite the temporary declines in enrollments that were noticeable only at the state’s two most elite public universities, the overall population of underrepresented minority students rose steadily as more entered and more graduated from the institutions for which they were fully qualified.
This article highlights the actual numbers of undergraduate degrees awarded rather than simple statistics on admitted freshmen, although there were noticeably significant jumps in ethnic minority enrollments at UC Riverside and UC Santa Barbara. The combined number of blacks and Hispanics who annually earned a bachelor’s degree at the UC rose from 5,123 in 1999 to 14,753 in 2018, a 188% increase in 19 years. Both the UC and CSU systems have expanded their race-neutral outreach efforts to help prepare for college low-income students from school districts with low university participation rates, partnering with those schools to enable them to develop a more academically sound curriculum.
Ending racial preferences and gender double standards in California has produced none of the social traumas that Proposition 209 opponents swore would occur. No campus ever became remotely “lily white” or “resegregated,” to use the divisive racist terms reflexively deployed by these adversaries. Instead, differences in university academic performances narrowed considerably, as there were fewer mismatches between students’ levels of preparation to succeed in college and the institutions in which they enrolled, and from which they eventually graduated.
As shown in table 23, from 1999 to 2018, the number of black students who earned baccalaureate degrees from the UC and from the CSU systems increased from 3,856 to 5919, a 54% jump in 19 years. Over that same 19-year period, the number of Hispanic students who earned a baccalaureate degree from both systems combined grew from 14,330 to 54,420, a 280% increase.
| Black Baccalaureate Degrees | 1999 | 2006 | 2014 | 2018 | Increase, '99-'18 |
| University of California System | 1139 | 1170 | 1609 | 2061 | 81% |
| California State University System | 2717 | 3440 | 3460 | 3858 | 42% |
| Califonia Public Universities Total | 3856 | 4610 | 5069 | 5919 | 54% |
| Hispanic Baccalaureate Degrees | 1999 | 2006 | 2014 | 2018 | Increase, '99-'18 |
| University of California System | 3984 | 5287 | 9656 | 12692 | 219% |
| California State University System | 10346 | 14483 | 26637 | 41728 | 303% |
| Califonia Public Universities Total | 14330 | 19770 | 36293 | 54420 | 280% |
| Black and Hispanic Baccalaureate Degrees | 1999 | 2006 | 2014 | 2018 | Increase, '99-'18 |
| University of California System | 5123 | 6457 | 11265 | 14753 | 188% |
| California State University System | 13063 | 17923 | 30097 | 45586 | 249% |
| Califonia Public Universities Total | 18186 | 24380 | 41362 | 60339 | 232% |
The evidence from public contracting, especially transportation construction, suggests that weaker, less competitive firms that were previously dependent on racial quotas or gender set-asides predictably failed when such designations were no longer legally available. Those contractor and subcontractor businesses headed by women or ethnic minorities that thrived and expanded did so because they were run by people who had the qualities necessary for success in the business world: patience, hard work, ingenuity, innovativeness, education, and the ability to delay gratification. That put them in a position to enjoy the financial rewards that came with those decidedly middle-class values.
They were judged as individuals by their own character and merits, not by the color of their skin, their gender, or stereotypes. As Harvard psychologist Steven Pinker put it, “Equality is not the empirical claim that all groups of humans are interchangeable; it is the moral principle that individuals should not be judged or constrained by the average properties of their group.”55
Over the past twenty-four years, public employees have been hired through improved recruitment and screening, given better training, and evaluated fairly and equitably on the job. As race and gender continue to recede as qualifications for employment in California, one hopes that the defenders of double standards will retreat from their antagonism to Proposition 209.
Gender differences that persist among college majors or in occupational concentrations anywhere in America primarily reflect individual differences in career choices, not discriminatory barriers to women’s advancement. In 2005–06, women earned 66% of all doctorates in both education and the health sciences, and 59% of those in the social sciences. Men earned 80% of the doctorates in engineering and 70% of all doctorates in the physical sciences. In 2006 nationwide, the proportion of students in graduate schools who were members of a racial or ethnic minority was 28%, up from 26% in 2005.56
In the years since Proposition 209 was enacted, the gaps in California public employment rates between men and women, and between whites, blacks, and Hispanics have continued to narrow. Racial favoritism and gender preferences are not the reasons for the redistribution of public employment jobs, as the magnitude and nature of those shifts remain small.
This is good news indeed. California under Proposition 209 has been a success story. It’s a shame that the “diversity industry” remains stubbornly unable to join the celebration.
1 The end of racial or gender preferences prompted several major municipalities (including Los Angeles, San Jose, and Sacramento) and at least one state agency (Caltrans) to petition the federal government either to violate Proposition 209 or to reinstitute preferential treatment through participation goals that would designate a specific percentage of minority and women subcontractors or employees.
2 Susan Kaufmann and Anne Davis, “The Gender Impact of the Proposed Michigan Civil Rights Initiative” (paper, University of Michigan, Center for the Education of Women, Ann Arbor, MI, March 2005), 7, http://cew.umich.edu/PDFs/11-05%20MCRI.pdf.
3 The defense of double standards sank to absurd depths in Michigan when an interdenominational group of religious leaders claimed in 2006 that defending affirmative action preferences was a “moral imperative,” citing Christian principles, Jewish scripture, and Muslim texts to support their position. Gregg Krupa, “Religious Leaders Pledge to Defeat Affirmative Action Proposal,” Detroit News, September 13, 2006.
4 Quoted in Kevin Mooney, “Giuliani Urged to Back Anti-Quota Laws to Win Conservative Support,” Cybercast News Service (www.CNSNews.com), August 23, 2007, http://web.archive.org/web/20071011114220/https://www.cnsnews.com/ViewPolitics.asp?Page=/Politics/archive/200708/POL20070823b.html.
5 Essential investigations that examine sub-cultural differences toward academic rigor and grapple with many inconvenient realities about race, culture, and educational achievement include Stephan Thernstrom and Abigail Thernstrom, No Excuses: Closing the Racial Gap in Learning (New York: Simon and Schuster, 2003); John Ogbu, Black Students in an Affluent Suburb: A Study in Academic Disengagement (Mahwah, NJ: Erlbaum Publishers, 2003); Elijah Anderson, Code of the Street: Decency, Violence, and the Moral Life of the Inner City (New York: Norton, 1999); Jeannie Oakes, Keeping Track: How Schools Structure Inequality, 2nd ed. (New Haven, CT: Yale University Press, 2005); and Bill Cosby and Alvin Poussaint, Come On People: On the Path from Victims to Victor s(Nashville: Nelson Publishers, 2007), especially chapter 4.
6 UC Statistical Summary of Students and Staff, https://www.ucop.edu/ucophome/uwnews/stat/, accessed December 1, 2007; UC StatFinder, http://statfinder.ucop.edu, accessed December 5, 2007: UC Fact Sheets, https://www.ucop.edu/news/factsheets/Flowtrc_9506.pdf, accessed December 4, 2007; Correspondence with Samuel J. Agronow, Coordinator of Admissions Research and Evaluation, University of California, Office of the President; Correspondence with James Litrownik, Coordinator of Data Management, Academic Advancement, University of California, Office of the President.
7 Degrees Awarded Data, University of California, https://www.universityofcalifornia.edu/infocenter/degrees-awarded-data, accessed July 7, 2020.
8 California Department of Education (https://www.cde.ca.gov), Public School Summary Statistics, 1996-97 to 2005-06, http://www.cde.ca.gov/ds/sd/cb/sums05.asp, accessed November 20, 2007; Graduates by Ethnicity for 2016-17, California Department of Education Educational Demographics Unit, https://dq.cde.ca.gov/dataquest/GraduateReporting/GraduatesByEth.aspx?cTopic=Graduates&cChoice=StGrdbyEt&cYear=2016-17&level=State&cType=All&cGender=B&cGroup=G12, accessed July 9, 2020.
9 Undergraduate Admissions Summary, University of California, https://www.universityofcalifornia.edu/infocenter/admissions-residency-and-ethnicity, accessed July 7, 2020.
10 Charles Geshekter, “The Effects of Proposition 209 on California: Higher Education, Public Employment, and Contracting,” September 25, 2008, https://www.nas.org/blogs/article/the_effects_of_proposition_209_on_california_higher_education_public_employ;University of California Undergraduate Work Team of the Study Group on University Diversity, Recommendations and Observations (September 2007), 39, https://ucnet.universityofcalifornia.edu/working-at-uc/our-values/diversity.html/documents/07-diversity_report.pdf, accessed November 27, 2007.
11 UC Statistical Summary of Students and Staff, https://www.ucop.edu/ucophome/uwnews/stat/, accessed December 1, 2007; UC StatFinder, http://statfinder.ucop.edu, accessed December 5, 2007: UC Fact Sheets, https://www.ucop.edu/news/factsheets/Flowtrc_9506.pdf, accessed December 4, 2007; Correspondence with Samuel J. Agronow, Coordinator of Admissions Research and Evaluation, University of California, Office of the President; Correspondence with James Litrownik, Coordinator of Data Management, Academic Advancement, University of California, Office of the President; Undergraduate Admissions Summary, University of California, https://www.universityofcalifornia.edu/infocenter/admissions-residency-and-ethnicity, accessed July 7, 2020.
12 UC Statistical Summary of Students and Staff, https://www.ucop.edu/ucophome/uwnews/stat/, accessed December 1, 2007; UC StatFinder, http://statfinder.ucop.edu, accessed December 5, 2007: UC Fact Sheets, https://www.ucop.edu/news/factsheets/Flowtrc_9506.pdf, accessed December 4, 2007; Correspondence with Samuel J. Agronow, Coordinator of Admissions Research and Evaluation, University of California, Office of the President; Correspondence with James Litrownik, Coordinator of Data Management, Academic Advancement, University of California, Office of the President; Undergraduate Admissions Summary, University of California, https://www.universityofcalifornia.edu/infocenter/admissions-residency-and-ethnicity, accessed July 7, 2020.
13 Fall Enrollment at a Glance, University of California, https://www.universityofcalifornia.edu/infocenter/fall-enrollment-glance, accessed July 9, 2020.
14 Recommendations and Observations, 13. Elsewhere the report states that a goal of UC is the “inclusion of students…from every corner of our state and every segment of our population” (36).
15 Recommendations and Observations, 19, 23. This report seems to suggest that the university thinks its mission includes issues like community economic development and unequal K–12 education. The report cited efforts to remedy unequal opportunities with respect to the availability of Algebra I by offering a UC-approved two-year course. When it was unsuccessful, the Task Force agreed that “deeper interventions were needed,” but provided no specifics.
16 University of California, Academic Personnel Manual, 210-5 (d), 3, https://www.ucop.edu/acadadv/acadpers/apm/apm-210.pdf, accessed December 1, 2007.
17 UC Office of the President, Data Management and Analysis, http://www.ucop.edu/acadadv/datamgmt/welcome.html, accessed December 1, 2007.
18 UC Office of the President, Data Management and Analysis, http://www.ucop.edu/acadadv/datamgmt/welcome.html, accessed December 1, 2007.
19 Workforce Diversity, University of California, https://www.universityofcalifornia.edu/infocenter/uc-workforce-diversity, accessed July 7, 2020.
20 Workforce Diversity, University of California, https://www.universityofcalifornia.edu/infocenter/uc-workforce-diversity, accessed July 7, 2020.
21 University of California, The Report of the UC President’s Task Force on Faculty Diversity: The Representation of Minorities Among Ladder Rank Faculty, Berkeley, CA, May 2006, ii, https://www.ucop.edu/academic-personnel-programs/_files/faculty-diversity-task-force/report.pdf, accessed July 9, 2020.
22 UC Office of the President, Data Management and Analysis, http://www.ucop.edu/acadadv/datamgmt/welcome.html, accessed December 1, 2007; Biennial Higher Education Staff Information (EEO-6) Reports.
23 Workforce Diversity, University of California, https://www.universityofcalifornia.edu/infocenter/uc-workforce-diversity, accessed July 7, 2020.
24 Workforce Diversity, University of California, https://www.universityofcalifornia.edu/infocenter/uc-workforce-diversity, accessed July 7, 2020.
25 A good example is a lengthy article that focused almost entirely on UCLA but said little about the rest of the UC and nothing about the CSU. David Leonhardt, “The New Affirmative Action,” New York Times Magazine, September 30, 2007, https://www.nytimes.com/2007/09/30/magazine/30affirmative-t.html. Leonhardt showed that UCLA had apparently started to use applicants’ socio-economic status as an admitted proxy for race in admitting a handful of students despite their considerably lower SAT scores. Some alumni defenders and financial supporters even avowed a possible resort to “civil disobedience” to evade the requirements of Proposition 209.
26 Reports and Analytics, California State University, https://www2.calstate.edu/data-center/institutional-research-analyses/Pages/reports-and-analytics.aspx. accessed July 7, 2020.
27 Consortium for Student Retention Data Exchange (CSRDE), Data for California State University, http://www.asd.calstate.edu/csrde/index.shtml, accessed December 1, 2007. This table tabulates the number of baccalaureate degrees awarded in each of four signpost academic years: 1995-96 (pre-Proposition 209), 2000-01, 2005-06 and 2006-07 for each ethnic group. The table lists the top five identifiable ethnic groups and the growing category where a student's ethnicity is unknown. It indicates what percentage each ethnic group accounted for of the total number of degrees awarded for each of those four academic years. The bottom line of the table indicates the percentage increase from 1995-96 through 2006-07 of undergraduate degrees awarded for each ethnic group. Where the data were available for 2000-01, 2005-06, and 2006-07, the table also includes the total enrollment of students by their ethnicity for the entire CSU system.
28 Reports & Analytics, California State University, https://www2.calstate.edu/data-center/institutional-research-analyses/Pages/reports-and-analytics.aspx, accessed July 7, 2020.
29 For 2006, the actual ethnicity was unknown for 11.6% (or 102) of all new appointments. However, the gender breakdown of those 102 was known: 43% (actual number, 44) were females and 57% (actual number, 58) were males. Thus, the actual percentage of females among all new 2006 faculty appointments was 49.7% (28.1% white females, 16.6 minority females, 5% unknown ethnicity females).
30 California State University: http://www.calstate.edu/HR/FacDemoStudy1985_2002.pdf; http://www.calstate.edu/HR/FacRecSurvRep05.pdf;
http://www.calstate.edu/HR/FacRecSurvRep06.pdf; Faculty Recruitment and Retention in the CSU, https://www.csus.edu/academic-affairs/faculty-advancement/_internal/_documents/faculty-diversity-recruitment-in-the-csu.pdf. For 2006, the actual ethnicity was unknown for 11.6% (or 102) of all new appointments. However, the gender breakdown of those 102 was known: 43% (actual number, 44) were females and 57% (actual number, 58) were males. Thus, the actual percentage of females among all new 2006 faculty appointments was 49.7% (28.1% white females, 16.6 minority females, 5% unknown ethnicity females).
31 Faculty Recruitment and Retention in the CSU, California State University, https://www.csus.edu/academic-affairs/faculty-advancement/_internal/_documents/faculty-diversity-recruitment-in-the-csu.pdf.
32 Office of Data Research and Analysis, California State University, Office of the Chancellor, Long Beach, CA 90802.
33 Faculty Recruitment and Retention in the CSU, California State University, https://www.csus.edu/academic-affairs/faculty-advancement/_internal/_documents/faculty-diversity-recruitment-in-the-csu.pdf.
34 Head Count of Full-Time Faculty by Tenure Status and Race/Ethnicity*, Fall 2019 and Fall 2014, California State University, https://www2.calstate.edu/csu-system/faculty-staff/employee-profile/csu-faculty/Pages/headcount-of-full-time-faculty-by-tenure-status-and-ethnicity.aspx.
35 This came from an announcement for a tenure-track position to teach British history in the history department at CSU, Chico, starting Fall 2007; the other one was to teach the ancient world starting Fall 2008. Despite several requests to the departmental search committee for an explanation with clear examples and empirical evidence why this was included as a criterion, no one could do so, although some faculty insisted that the college dean and the university provost had required it.
36 In fairness, a December 2007 audit found little evidence that in the past decade the CSU system was guilty of racial or gender discrimination. The State Auditor, Elaine Howle, seemed less familiar with the strictures of Proposition 209 than CSU administrators as her office urged CSU to deploy race- and gender-conscious “diversity” standards in its hiring decisions. Despite its unwieldy title, the report found that in a system of 45,000 employees (faculty, administrators, and clerical staff) over a four-year period (2002–2006), a cumulative total of only 63 claims had been filed “for alleged race or gender discrimination,” about 16 per year or roughly 1 in 650 employees. California State Auditor, California State University: It Is Inconsistent in Considering Diversity When Hiring Professors, Management Personnel, Presidents, and System Executives, Report 2007-102.2, Sacramento, CA, Bureau of State Audits, December 2007, 55–56, https://www.bsa.ca.gov/pdfs/reports/2007-102.2.pdf, accessed July 9, 2020.
37 California Public Contract Code § 10115,https://leginfo.legislature.ca.gov/faces/codes_displaySection.xhtml?lawCode=PCC§ionNum=10115.
38 Hi-Voltage Wires Works Inc. v. City of San Jose, 24 Cal. 4th 537 (2000), https://law.justia.com/cases/california/supreme-court/4th/24/537.html. In this important case, the California Supreme Court found that the City of San Jose’s targeted outreach program violated Proposition 209. Using the dictionary, the Court determined that “‘discriminate’ means to ‘make distinctions in treatment; show partiality (in favor of) or prejudice against’: ‘preferential’ means ‘giving preference,’ which is a ‘giving of priority or advantage to one person…over others.’”
39 Monique W. Morris, et al., Free to Compete? Measuring the Impact of Proposition 209 on Minority Business Enterprises(Discrimination Research Center, program of The Impact Fund, Berkeley, CA, 2006), https://www.law.berkeley.edu/files/thcsj/Free_to_Compete.pdf; Monique W. Morris, et al., A Vision Fulfilled? The Impact of Proposition 209 on Equal Opportunity for Women Business Enterprises(Thelton E. Henderson Center for Social Justice, University of California, Berkeley School of Law, Berkeley, CA, September 2007), https://www.law.berkeley.edu/files/thcsj/A_Vision_Fulfilled_Sept_2007.pdf.
40 Roger Clegg (president and general counsel of the Center for Equal Opportunity [CEO], on behalf of the CEO and the American Civil Rights Institute) to the Office of Civil Rights, California Department of Transportation, “Letter,” September 13, 2007.
41 See Morris, Free to Compete?; Morris, A Vision Fulfilled? A Vision Fulfilled? makes an extremely important qualification: “With an 11-year survival rate of less than 40 percent for all races and ethnicities, the difficulties for women-owned businesses to compete in the transportation construction industry are apparent. However, without an appropriate comparison group, such as the survival of small businesses primarily owned by white men, it is difficult to ascertain the relative success of WBEs and the impact of Proposition 209 on them.” (22).
42 Clegg, “Letter.”
43 Morris, Free to Compete? 27. Subsequent references will be cited parenthetically.
44 Morris et al., A Vision Fulfilled? 35–36.
45 Hi-Voltage Wires Works Inc. v. City of San Jose, 24 Cal. 4th 537 (2000).
46 Sharon Browne, “San Francisco’s Public Contracting Program Declared Unconstitutional” (unpublished paper, 2005).
47 George R. La Noue, “Identity Politics and Public Contracting: The Role of Prop 209” (unpublished paper, June 2006), 17. A professor at the University of Maryland, Baltimore County, La Noue provides a lucid summary of the court rulings that challenged the permissibility of MBEs at the state and federal levels before 1996 and charts the eventual “demise of disparity studies as a factor” after the enactment of Proposition 209.
48 Sharon Browne, Linda Chavez, and Ward Connerly, “Caltrans’ Misguided U-Turn on Contracts,” Los Angeles Times, October 31, 2007, https://www.latimes.com/archives/la-xpm-2007-oct-31-oe-connerly31-story.html. The Caltrans study itself showed insignificant disparities and little evidence to establish any discrimination based on race or gender. See BBC Research and Consulting, Availability and Disparity Study: California Department of Transportation, Final Report, Denver, CO, June 29, 2007, executive summary, 3; available at https://dot.ca.gov/hq/bep/disparity.htm.
49 Justin Marion, “How Costly Is Affirmative Action? Government Contracting and California’s Proposition 209” (unpublished paper, November 2006), 4, https://ideas.repec.org/a/tpr/restat/v91y2009i3p503-522.html.
50 Clegg, “Letter.”
51 Table C-5, Department of Finance, Economic Research Unit, http://www.dof.ca.gov/, accessed November 20, 2007; Additional data provided by State Personnel Board, July 27, 2007; 2009-2010 Annual Census of Employees in State Civil Service, California Department of Human Resources, http://www.spb.ca.gov/reports/FY%202009-10%20Annual%20Census%20of%20Employees%20in%20the%20State%20Civil%20Service.pdf, accessed July 7, 2020; 2014 Annual Census of Employees in State Civil Service, California Department of Human Resources, https://www.calhr.ca.gov/Documents/ocr-census-of-employees-2014.pdf, accessed July 7, 2020; 2018 Annual Census of Employees in State Civil Service, California Department of Human Resources, https://www.calhr.ca.gov/Documents/ocr-census-of-employees-2018.pdf, accessed July 7, 2020.
52 Table C-5, Department of Finance, Economic Research Unit, http://www.dof.ca.gov/, accessed November 20, 2007; Additional data provided by State Personnel Board, July 27, 2007.
53 Table C-5, Department of Finance, Economic Research Unit, http://www.dof.ca.gov/, accessed November 20, 2007; Additional data provided by State Personnel Board, July 27, 2007; 2009-2010 Annual Census of Employees in State Civil Service, California Department of Human Resources, http://www.spb.ca.gov/reports/FY%202009-10%20Annual%20Census%20of%20Employees%20in%20the%20State%20Civil%20Service.pdf, accessed July 7, 2020; 2014 Annual Census of Employees in State Civil Service, California Department of Human Resources, https://www.calhr.ca.gov/Documents/ocr-census-of-employees-2014.pdf, accessed July 7, 2020; 2018 Annual Census of Employees in State Civil Service, California Department of Human Resources, https://www.calhr.ca.gov/Documents/ocr-census-of-employees-2018.pdf, accessed July 7, 2020.
54 UC Statistical Summary of Students and Staff, https://www.ucop.edu/ucophome/uwnews/stat/, accessed December 1, 2007; UC StatFinder, http://statfinder.ucop.edu, accessed December 5, 2007: UC Fact Sheets, https://www.ucop.edu/news/factsheets/Flowtrc_9506.pdf, accessed December 4, 2007; Correspondence with Samuel J. Agronow, Coordinator of Admissions Research and Evaluation, University of California, Office of the President; Correspondence with James Litrownik, Coordinator of Data Management, Academic Advancement, University of California, Office of the President; Consortium for Student Retention Data Exchange (CSRDE), Data for California State University, http://www.asd.calstate.edu/csrde/index.shtml, accessed December 1, 2007; Reports & Analytics, California State University, https://www2.calstate.edu/data-center/institutional-research-analyses/Pages/reports-and-analytics.aspx, accessed July 7, 2020.
55 Steven Pinker, The Blank Slate: The Modern Denial of Human Nature (New York: Penguin Books, 2002), 340.
56 Council of Graduate Schools, Office of Research and Policy Analysis, Graduate Enrollment and Degrees: 1996-2006, Report, Washington, D.C, 2007, available at https://www.cgsnet.org/ckfinder/userfiles/files/R_ED2006.pdf, accessed July 7, 2020.
Image: Justefrain, Public Domain