After our report, Ideological Intensification, was published last year, we received no criticism. This came as a surprise, but we suspect that our hypothesis—that diversity, equity, and inclusion (DEI) ideology has encroached on science—is self-evident.
We have finally received our first critic: Dr. Emilio Bruna at the University of Florida. Dr. Bruna leveled six critiques through posts on Twitter and a pre-print paper, culminating in his request that we retract our report. Dr. Bruna’s six critiques can be categorized as: 1) disagreement over the definition of “equity”; 2) the relativization of data; 3) allowing the y-axes to “float”; 4) the cleanliness of the datasets; 5) the presence of duplicate files in the National Science Foundation (NSF) and National Institutes of Health (NIH) datasets; and 6) the inclusion of duplicate files and non-scientific journals/literature in the Google Scholar and PubMed datasets.
We write to address these critiques in order:
1) Defining “Equity”
Dr. Bruna first disagreed with a paragraph in our report where we defined “equity” as an equality of outcomes. He argued that equity is about opportunities, not outcomes, and it seems that we will agree to disagree. In defense of our position, however, one should consider that Ibram X. Kendi—the author of some of the most widely cited DEI-related literature—states plainly that equity is about outcomes. Senator Bernie Sanders agreed that “equity” is best understood as an equality of outcomes, and the University of Florida (Dr. Bruna’s employer) states that it strives for “equitable outcomes.”
2) Relativizing Data
Dr. Bruna also took issue with the fact that some of our data—specifically the university Twitter data—was not “relativized.” He was concerned that we failed to show the rise of DEI language compared with the rise of all language through various technologies such as websites and tweets. There are two facts we fear Dr. Bruna may have overlooked, or that we failed to articulate clearly: First, regarding the relativization of university websites, we explained in the executive summary of the report that this was impossible. But we saw these trends again elsewhere, giving little reason to doubt our findings.
Second, regarding the Twitter data, there was no need to provide a base-rate comparison because we created the Twitter dataset to serve as a comparison to the website dataset. One should keep in mind that we discarded about 90% of the website data and sought a way to check our work, constructing the Twitter dataset in the process.
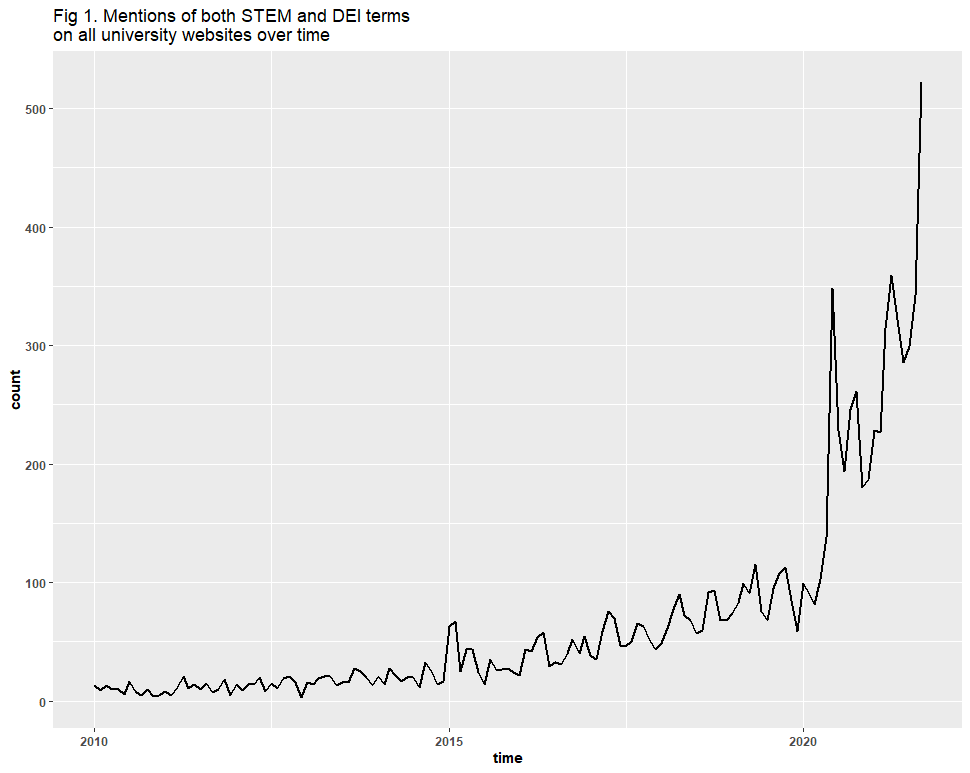
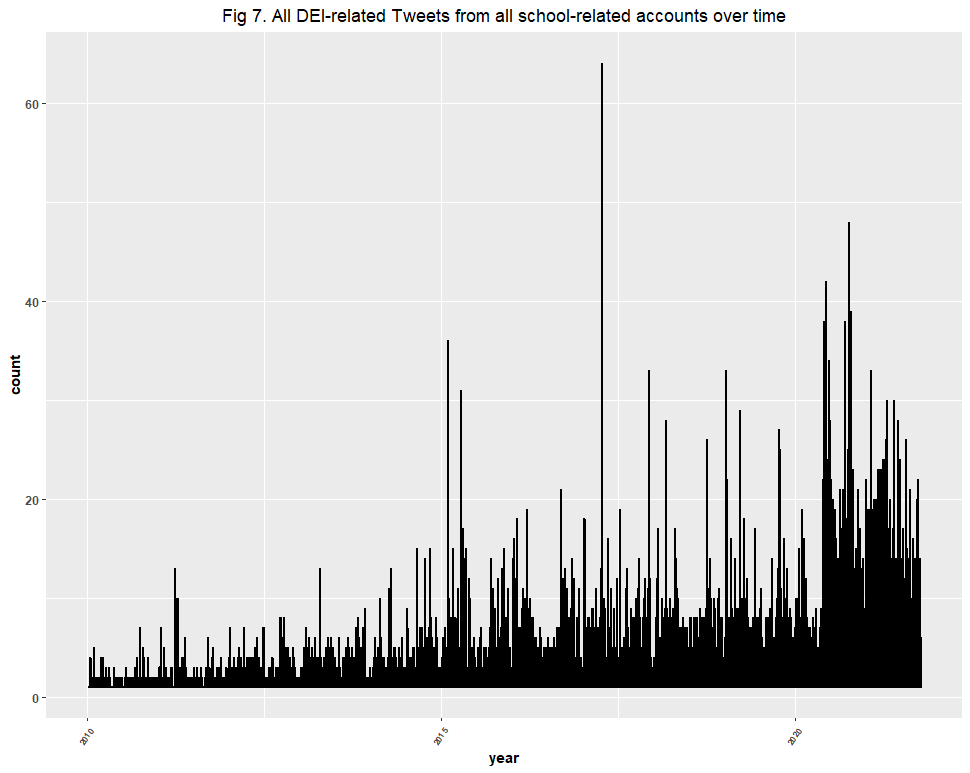
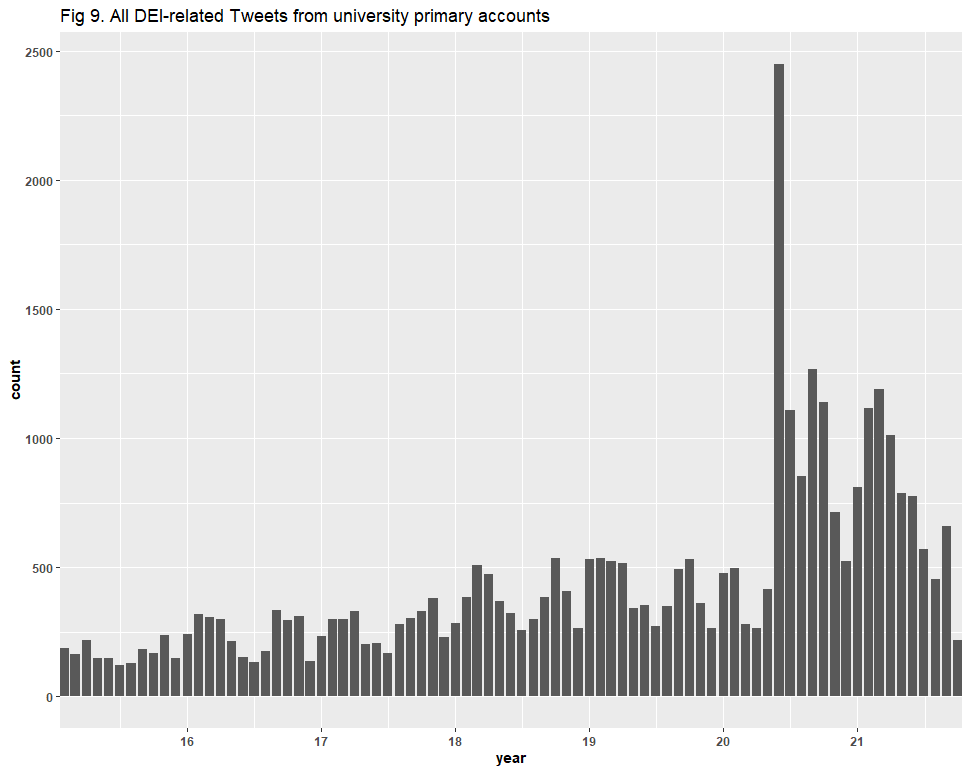
That check was successful too. Here is a side-by-side comparison of Figures 1, 7, and 9. The trend lines not only appear rather congruent, but each captured the spike in the summer of 2020, and another in 2021.
|
|
|
3. Floating (Y-)Axes
Dr. Bruna then took issue with our letting y-axes “float”—letting the computer determine the appropriate y-axis. His concern is that allowing the y-axes to float makes these increases appear larger than they are and may deceive the reader. However, in the footnotes of the report, we explained that letting the axes float lets us visualize the relative trends, as we have little interest in absolute counts.
4) Cleaning Data
Dr. Bruna’s fourth critique dealt with the cleanliness of our datasets, as he found false positives included therein, especially within the Twitter dataset. For example, within the Twitter dataset, “race”-related tweets have contexts ranging from skin color (relevant to DEI) to sports (irrelevant to DEI). Sampling the data, Dr. Bruna concluded a presence of false positives ranging by term from 1.89% to 36.7%. Here is a table Dr. Bruna created:
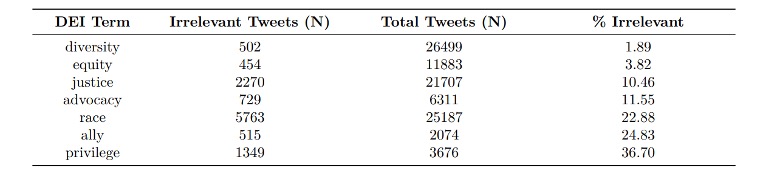
Again, we fear there is something that Dr. Bruna may have overlooked, or that we failed to articulate clearly enough. In the first section of the report—the section on university websites—and specifically in the sub-section titled “Data Sampling,” we explained that we had come across an error rate as high as 40%. With no reason to suspect that false positives increased over time, and knowing that 60% of the data would still signal an increase in DEI, we proceeded, noting that we saw the findings of the website data—which include the trends we sought to visualize and the presence of false positives—in the other datasets.
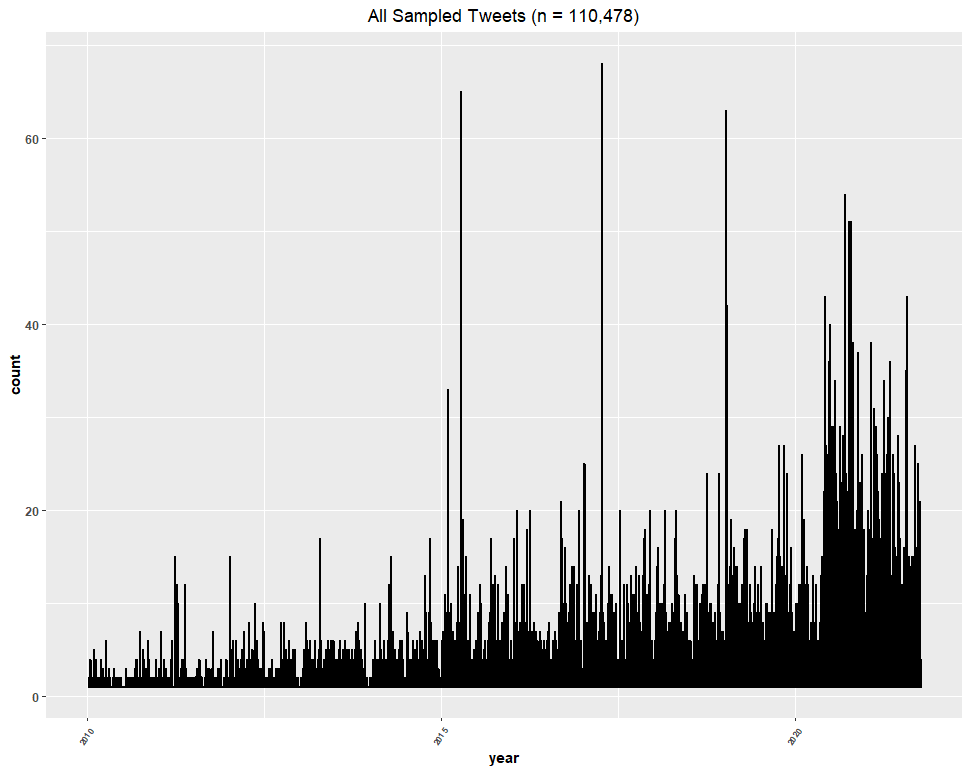
The question remains: did the inclusion of false positives in the Twitter dataset, or other datasets, undermine our conclusions? For whatever reason, Dr. Bruna did not recreate the graphs to answer that question. Therefore, we present the trend line of the DEI keywords that Dr. Bruna sampled, including the false positives:
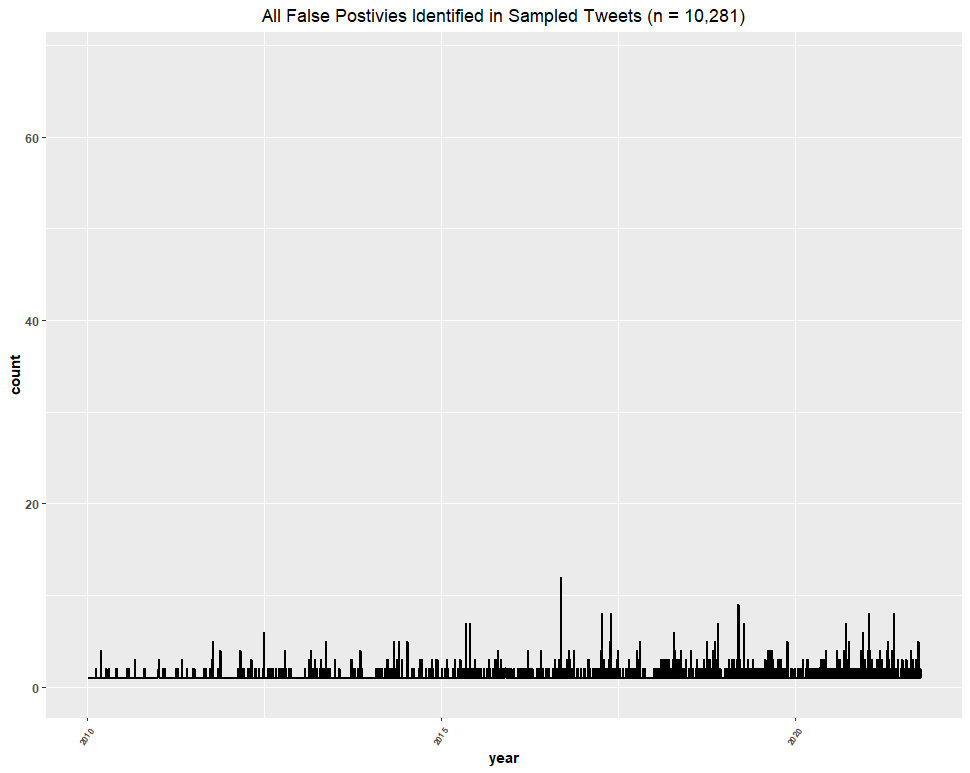
Then, we present the trend line of only the identified false positives, omitting actual data points and setting the y-axis to match the graph above so that we can make a direct comparison to determine the effect that the false positives had:
We then did the same thing with only university primary accounts:
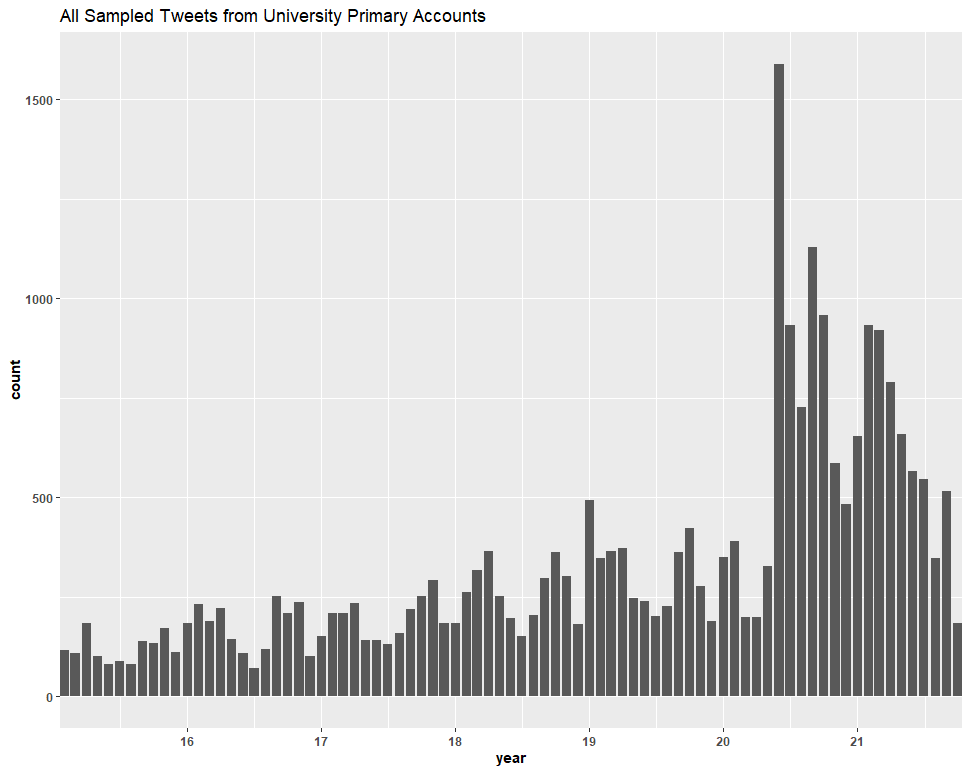
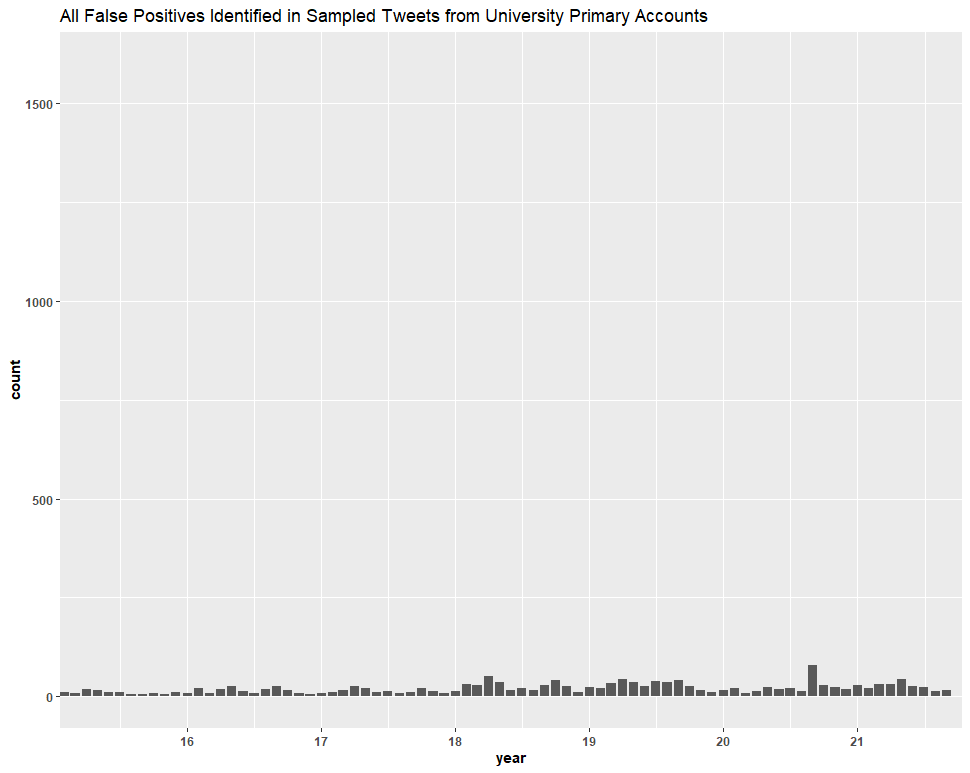
Clearly, the inclusion of false positives in the Twitter dataset (based on this sample of ~73% of the dataset) had no significant effect on our conclusions.
5) NSF and NIH Datasets
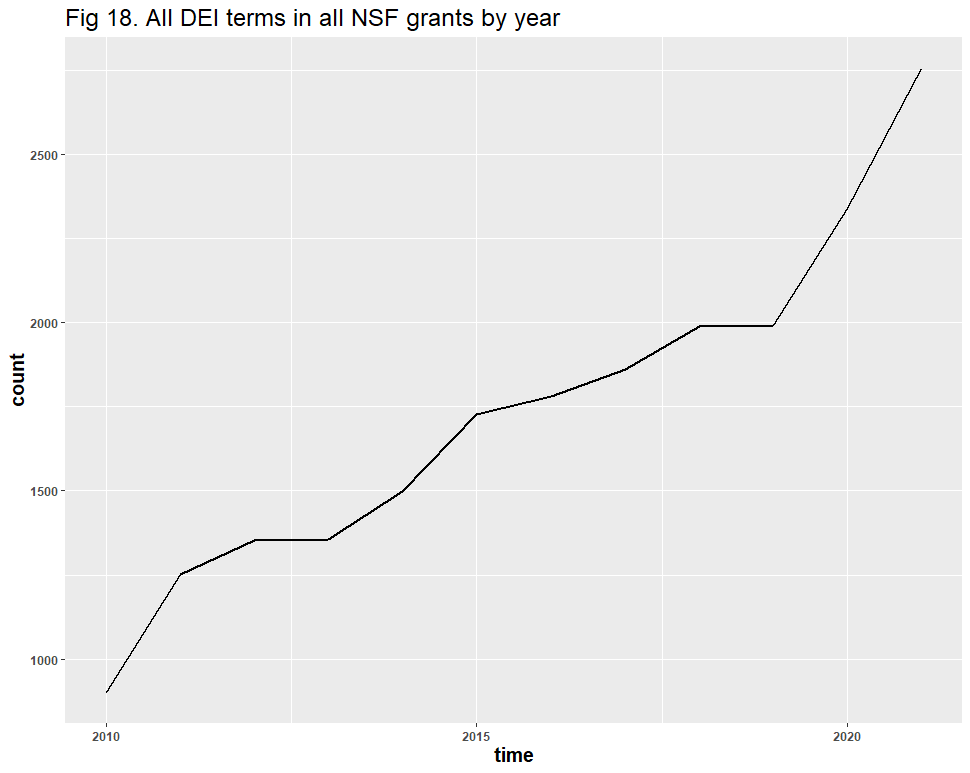
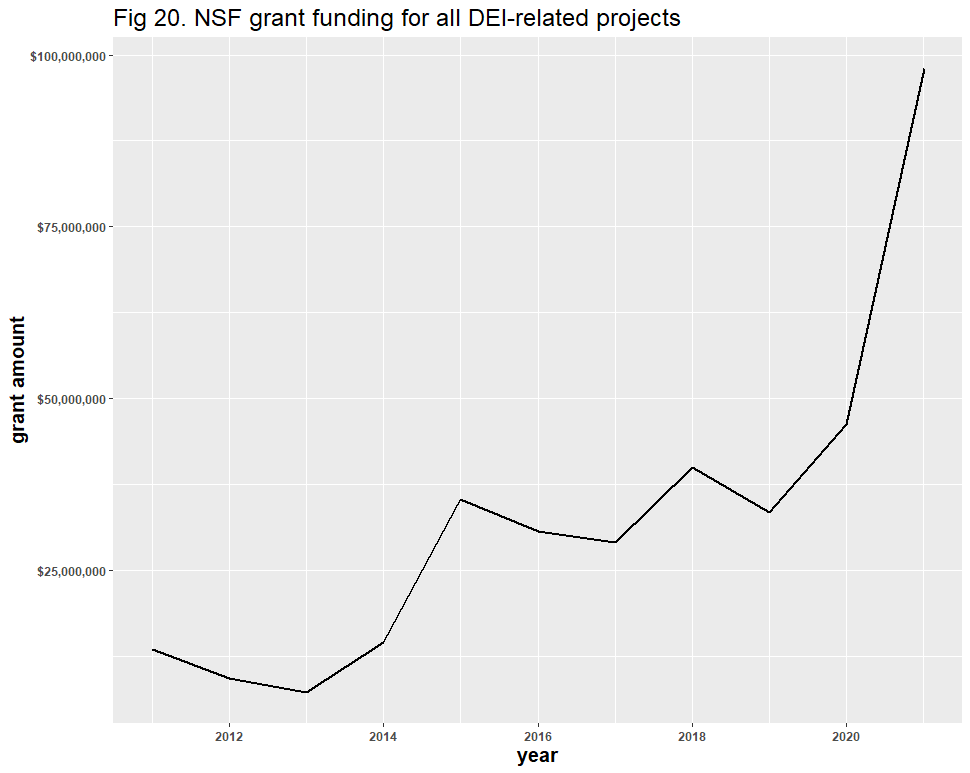
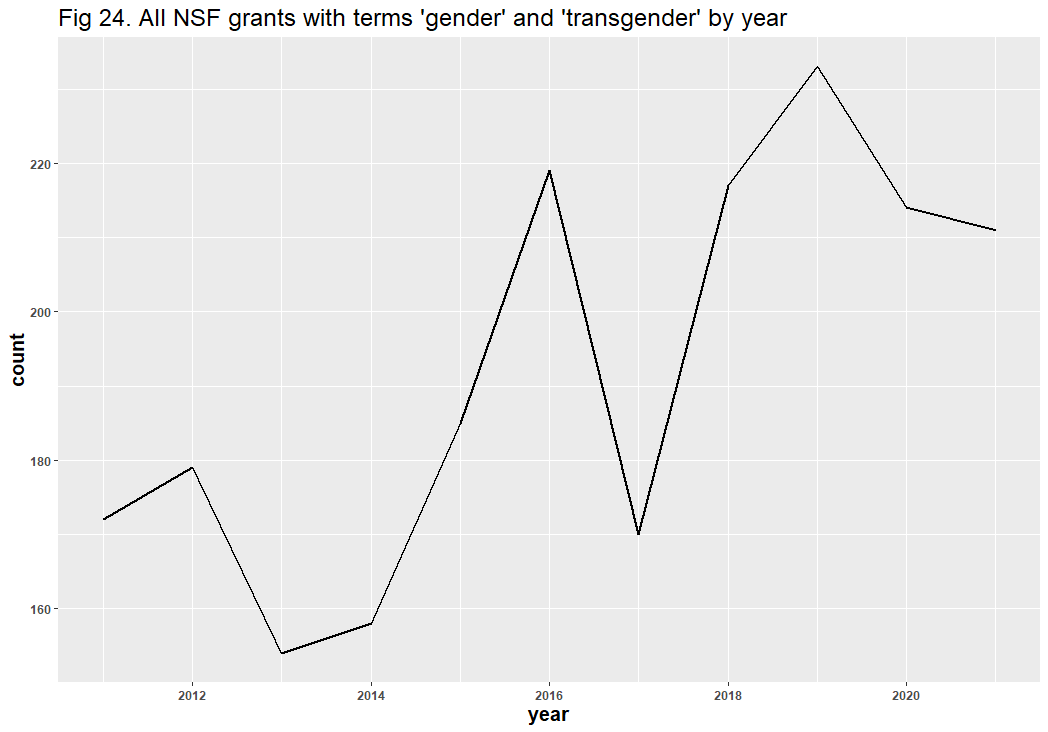
Dr. Bruna’s fifth critique regarded duplicate files in the National Science Foundation (NSF) and National Institutes of Health (NIH) datasets. As Dr. Bruna explained, if a successful grant proposal is shared by collaborators at different institutions, that proposal is represented by multiple “awards” in the agencies’ databases. He argued that because we did not consolidate these duplicates, we inflated the size of our NSF and NIH datasets. We disagree. The best way to know the trend of DEI in scientific grants is to count every time a DEI-related grant is awarded, caring little for the number of distinct proposals and projects shared by collaborators.
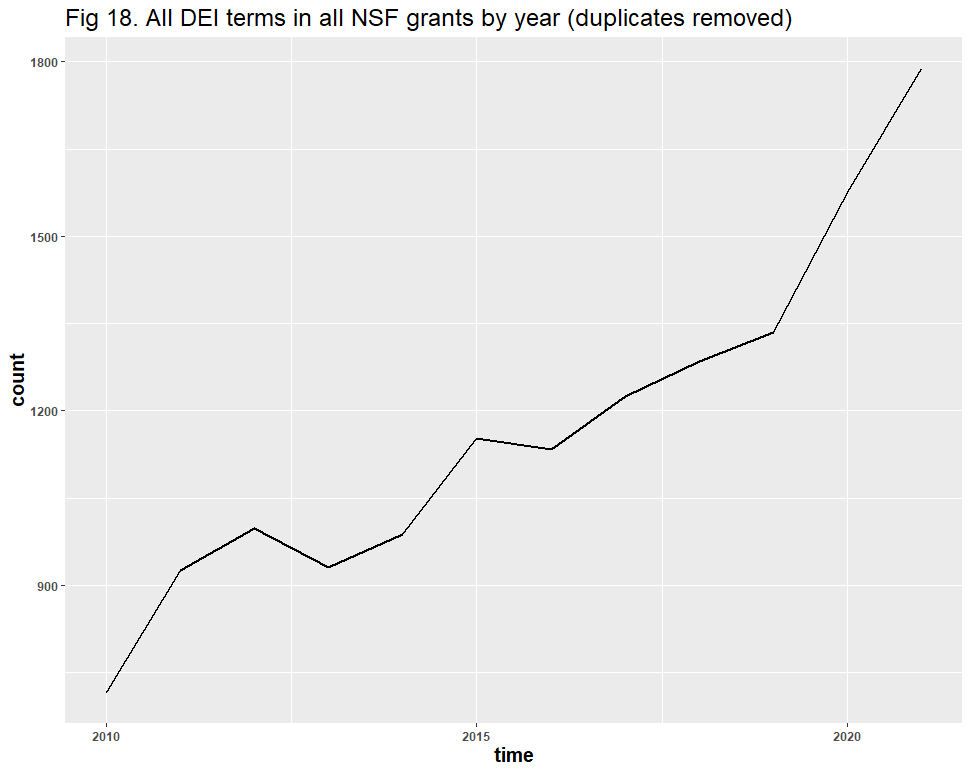
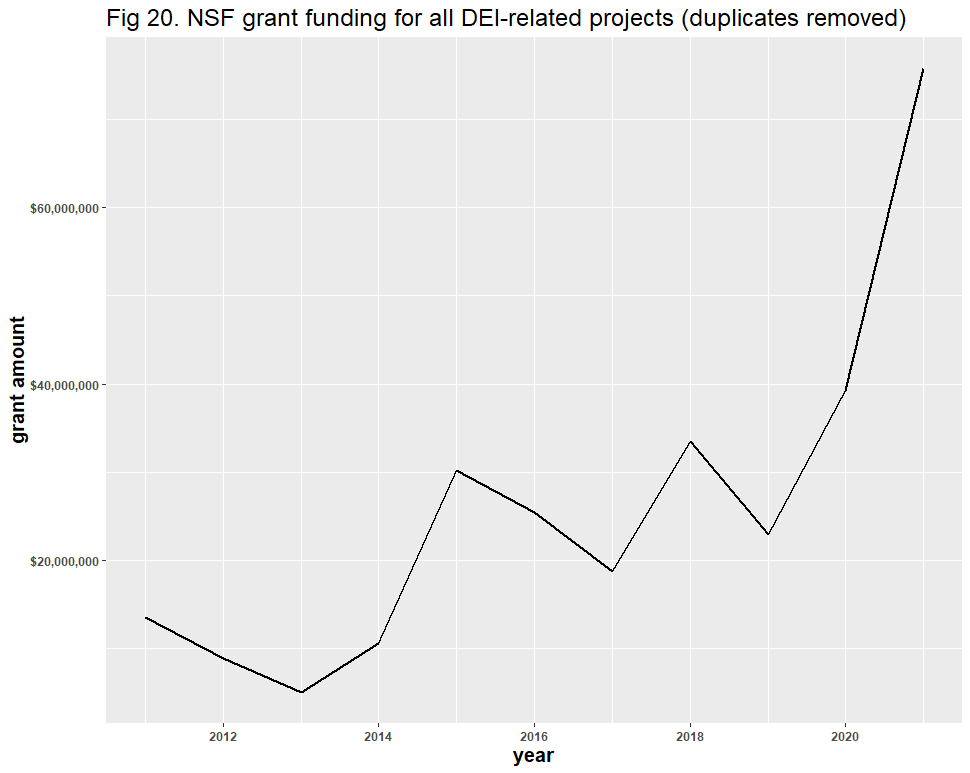
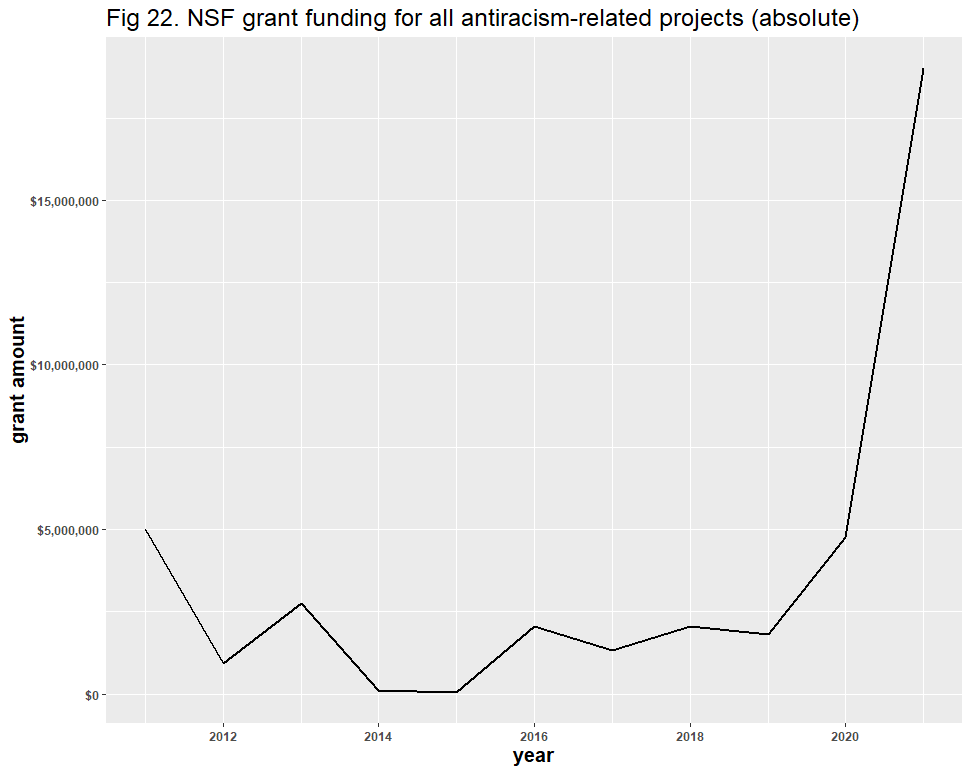
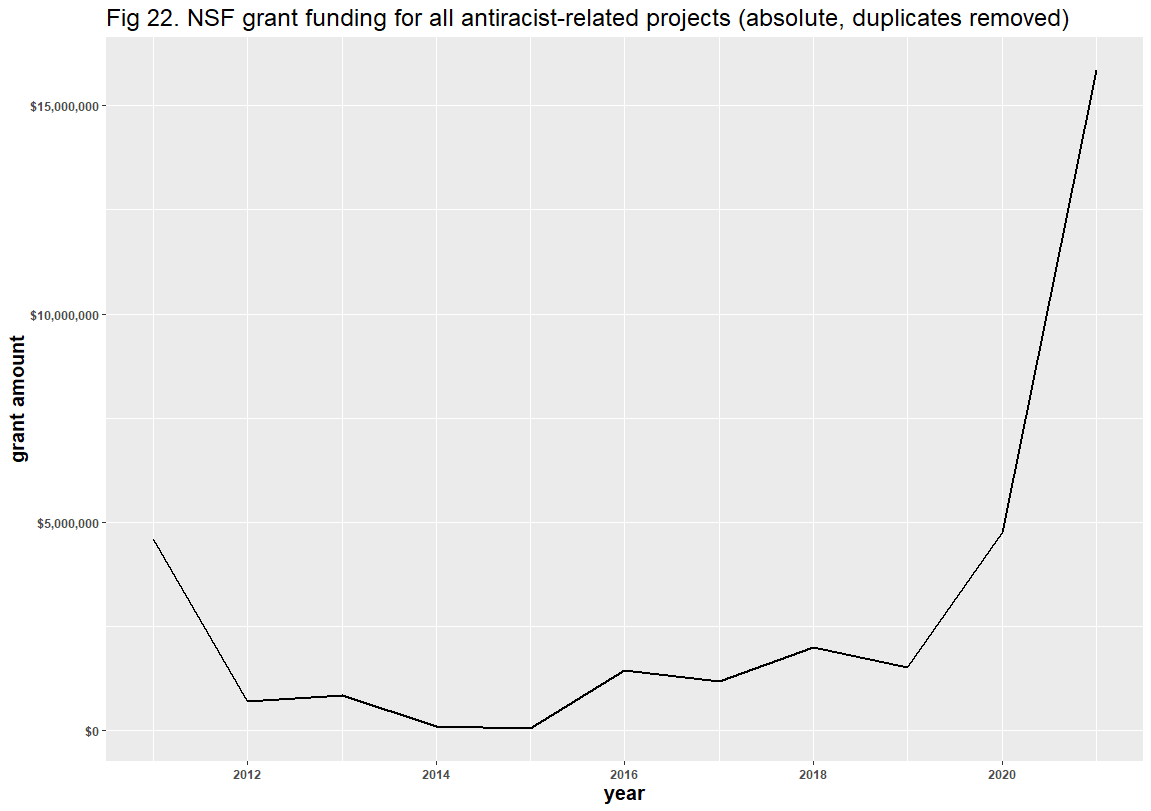
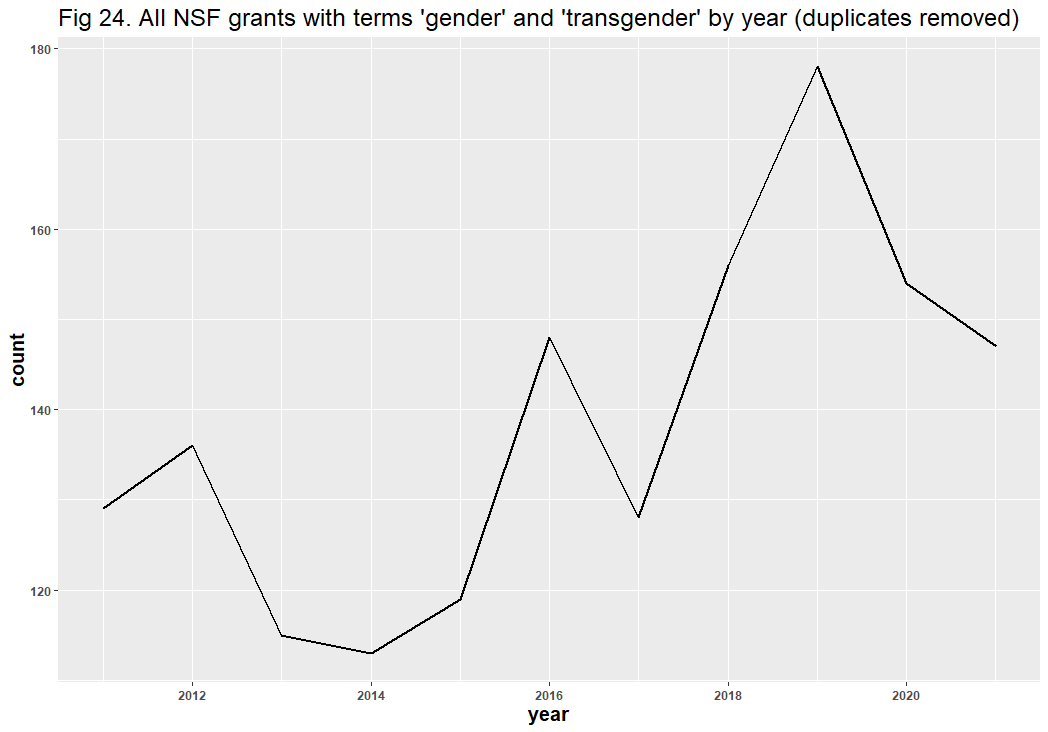
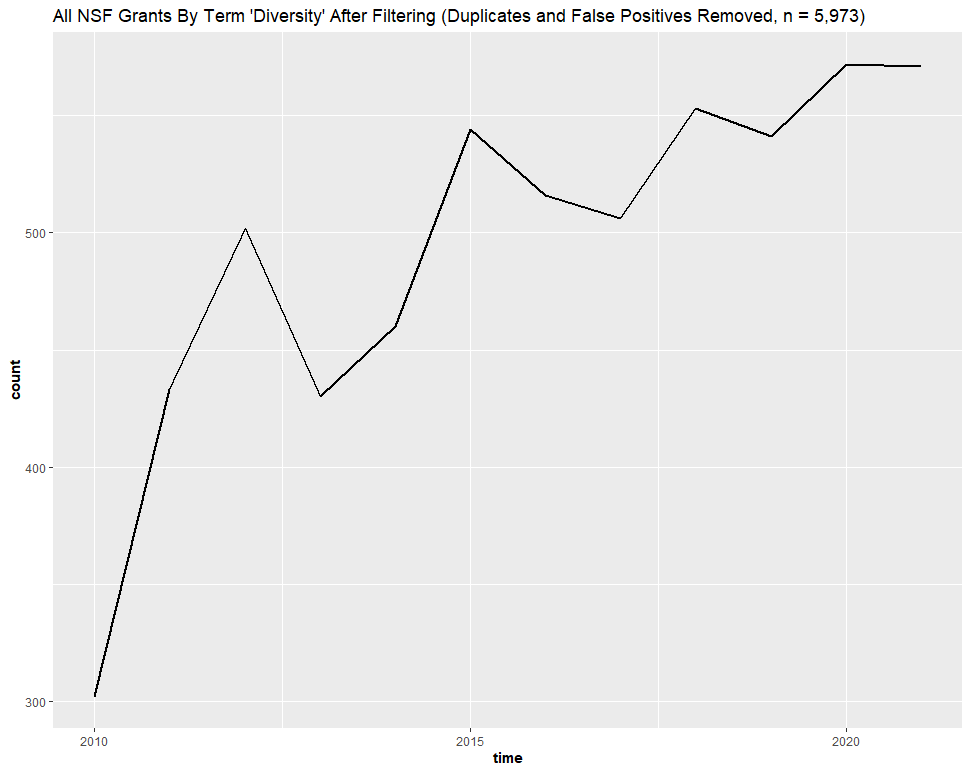
Dr. Bruna did not consolidate these duplicates to see if his graphs undermined our conclusions, but rather than consolidate the NSF duplicates ourselves, we simply removed them entirely, discarding approximately 30% of the dataset. The results show that the trend lines remain largely unaltered and that none of our stated conclusions were refuted. In fact, the removal of these duplicates clearly indicates that not only have the absolute counts of DEI-related projects increased in recent years, but so have collaborations on those distinct projects.
|
|
|
|
|
|
|
|
|
|
|
|
|
|
|
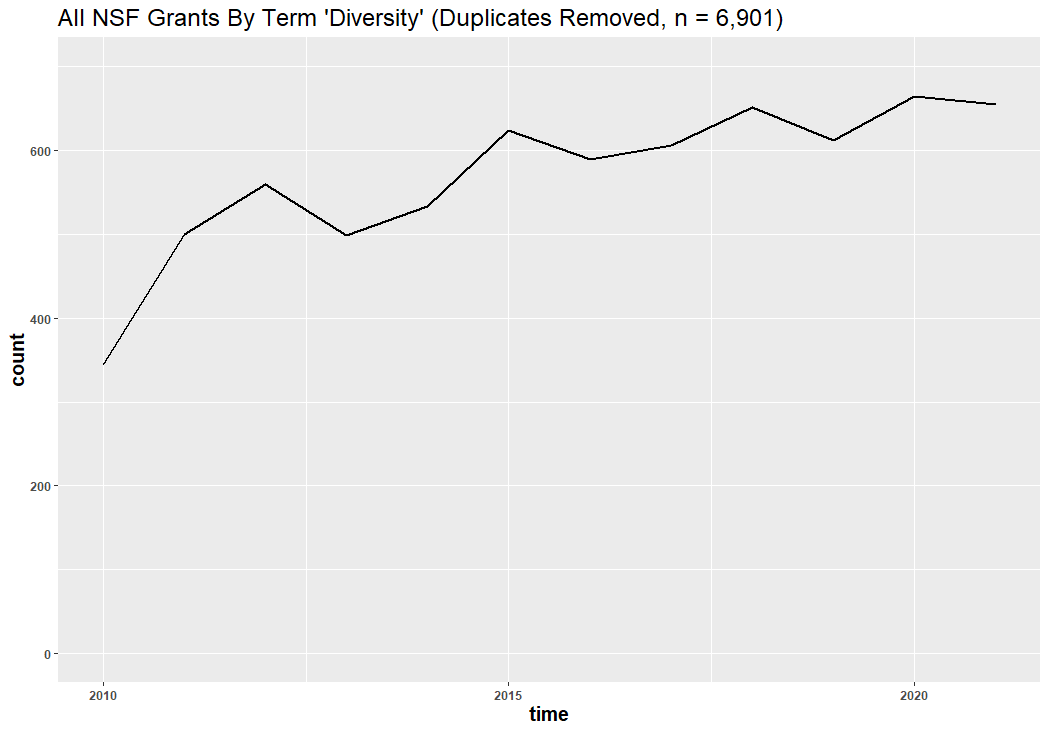
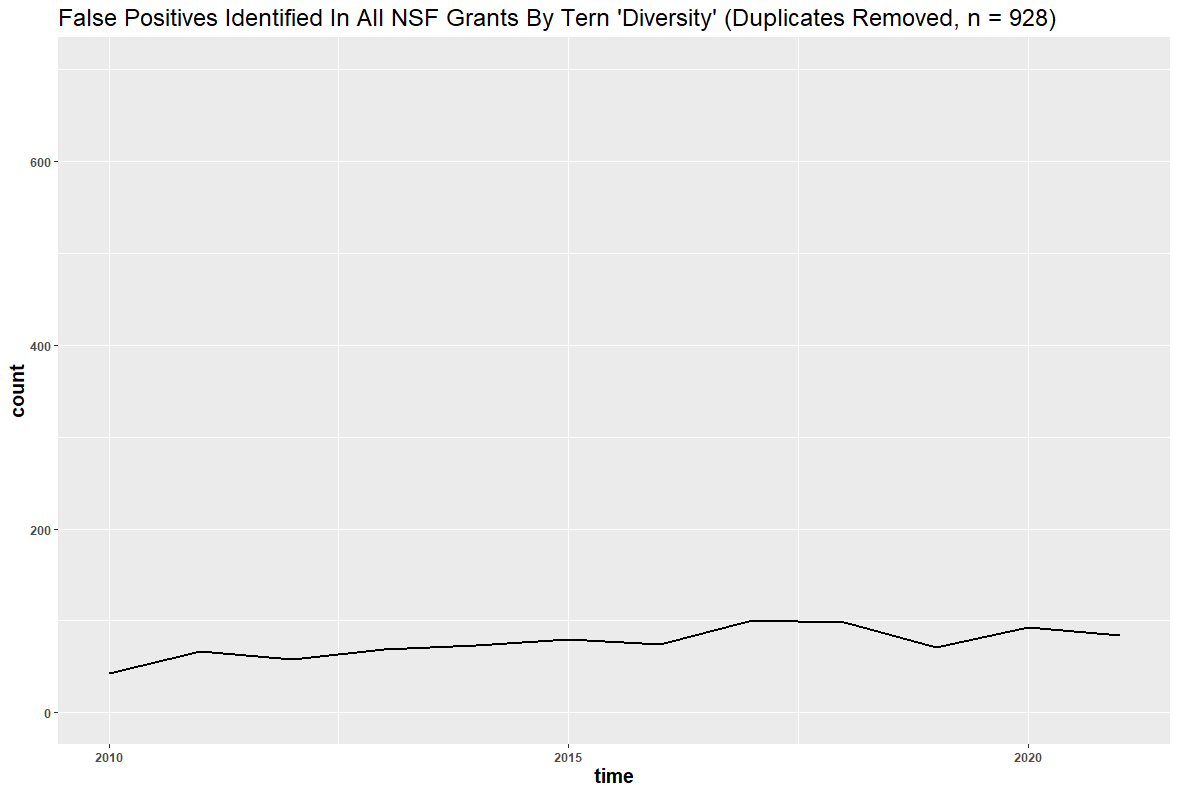
A question remains: might the inclusion of false positives have affected the results? Dr. Bruna identified “diversity” as the likeliest source of error, and his reasoning is understandable: “Diversity” in scientific contexts may refer to things like species diversity, rather than DEI. After removing all duplicate files and using similar methods from our Twitter analysis, we identified 928 false positives in the 6,901 diversity-related grants. These false positives appear to have had no significant effect on the DEI-related trend line:
|
|
|
Over the past decade, the total number of DEI-specific, “diversity”-related, distinct NSF projects almost doubled:
We sampled other keywords, but the return rates of false positives were much smaller elsewhere.
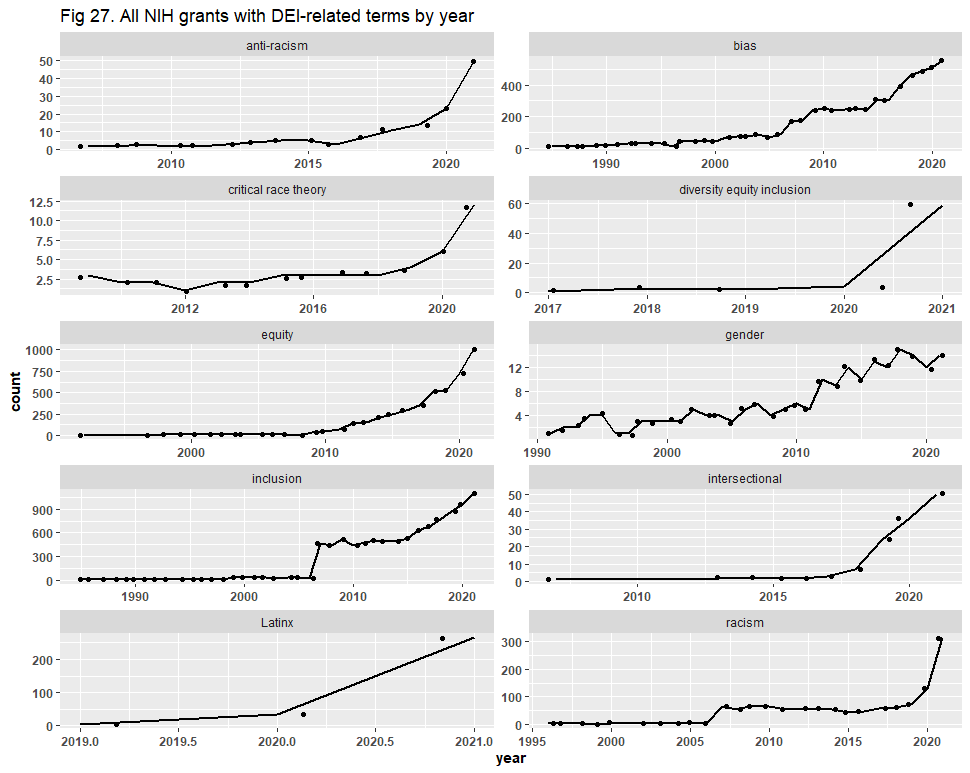
Next, we turn to the NIH duplicates, which, in addition to being grants / awards and not distinct grant proposals / projects, are also overlapping results from our ten keyword searches. We present our original results here:
There are various ways by which one could search for duplicates, and Dr. Bruna chose to group them by project title, program official information, and project start date. This method returned 17,544 files of the original 22,014 (80% of the dataset). Dr. Bruna did not recreate the graphs to show what effect these duplicates had, so we consolidated them and present the trend lines here:
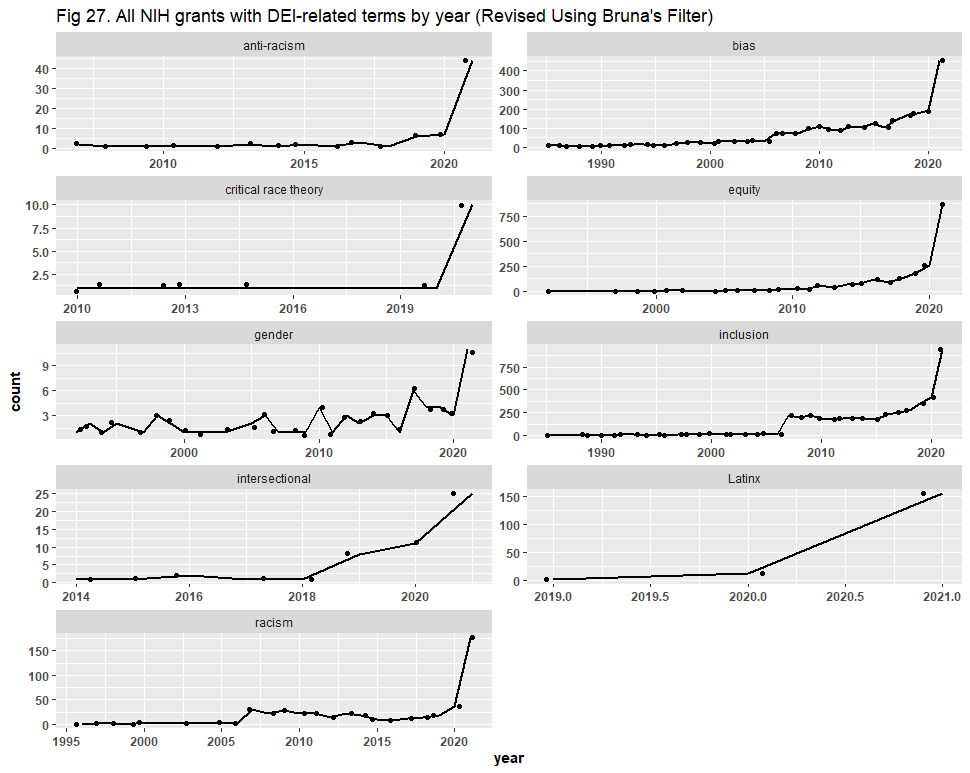
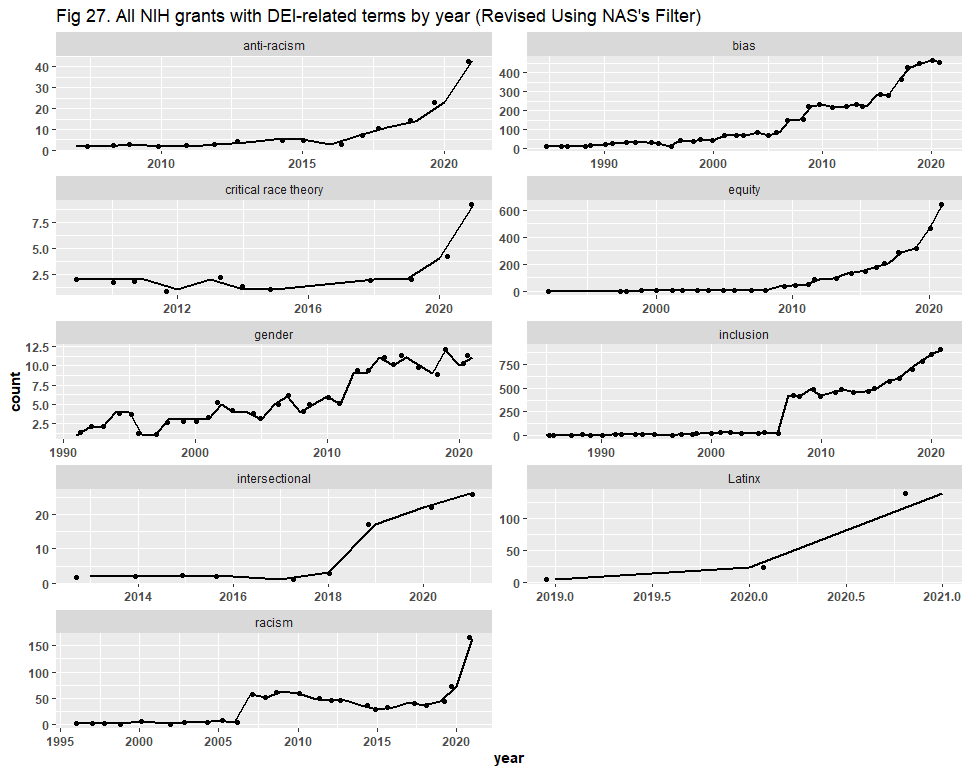
While the y-axis (now the number of distinct projects) shrunk due to consolidation, the trends we sought to visualize became steeper than originally presented. Dr. Bruna’s filter has, therefore, reaffirmed our conclusion that DEI has risen in NIH activity. To ensure that our analysis was robust, we then grouped the files by project number, serial number, and Data Universal Numbering System (DUNS) number. This returned 5,604 duplicates (~25% of the dataset). Upon recreating the graphs, our conclusions remain largely unaltered, although the trend lines here are not as steep as when we used Dr. Bruna’s filter:
We did, however, notice an error in the report. In the executive summary, we stated that “[t]he number of DEI-related projects receiving NIH funding grew significantly … increasing roughly 5 to 1000 times depending on the DEI term.” This statement should have said “percent,” not “times,” so, as initially written, it was not true based on any of the graphs above. Therefore, we have issued an erratum to the report, fixing that statement in the executive summary.
6) Google Scholar and PubMed
Dr. Bruna’s final critique dealt with the presence of duplicate files and non-scientific journals and articles in our Google Scholar and PubMed datasets. Dr. Bruna did not go the next step to show whether the inclusion of these duplicate files, non-scientific journals and articles, and false positives affected the trend lines we sought to visualize or our stated conclusions.
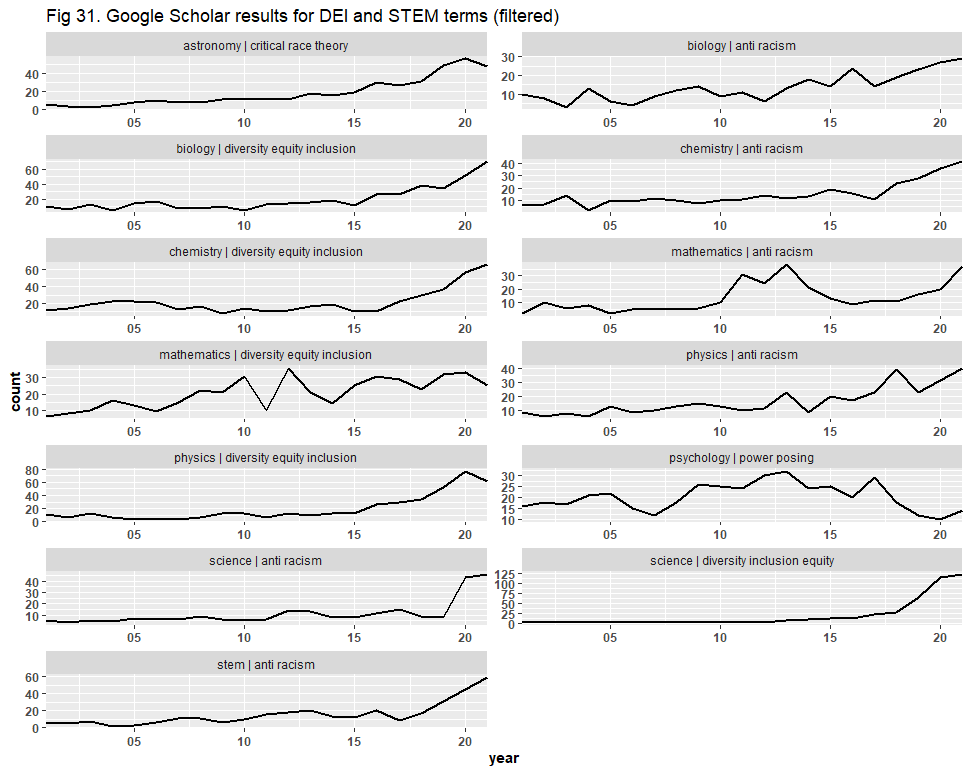
We began with the Google Scholar dataset of 13,066 files, where we identified and removed any duplicate files, leaving us with 9,540 files. We then identified any file with a “source” (i.e., journal) that was not STEM-related, and any file with no known source, and removed them even if the article was STEM-related. We concluded with only 5,918 files, having discarded ~55% of the dataset, and re-created the graphs.
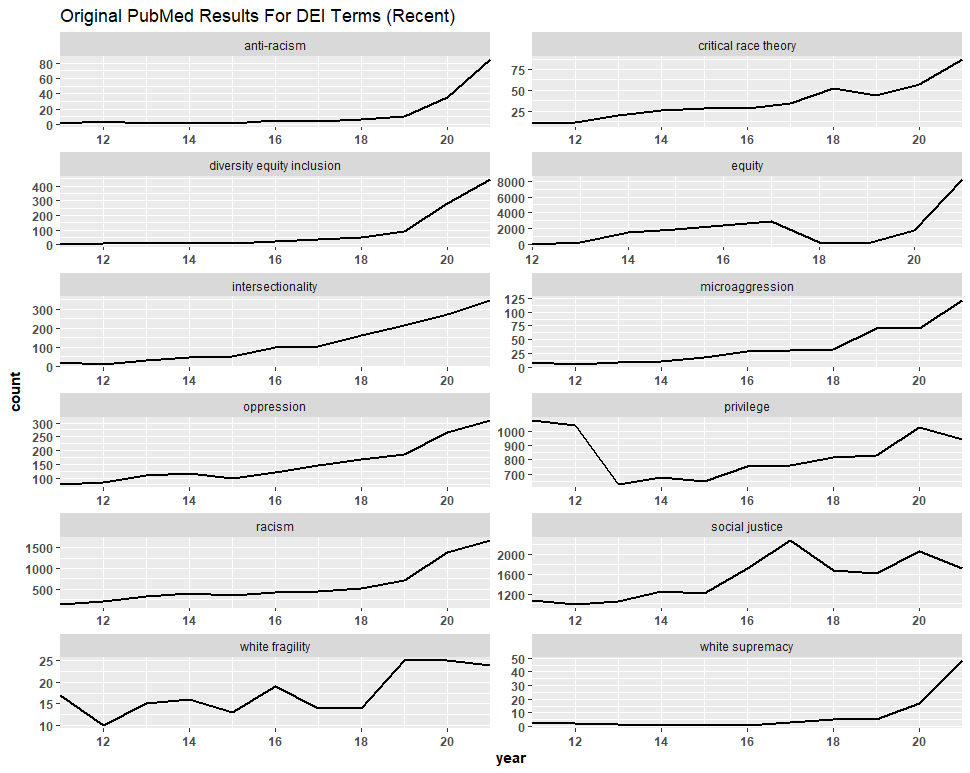
First, we present the original results:
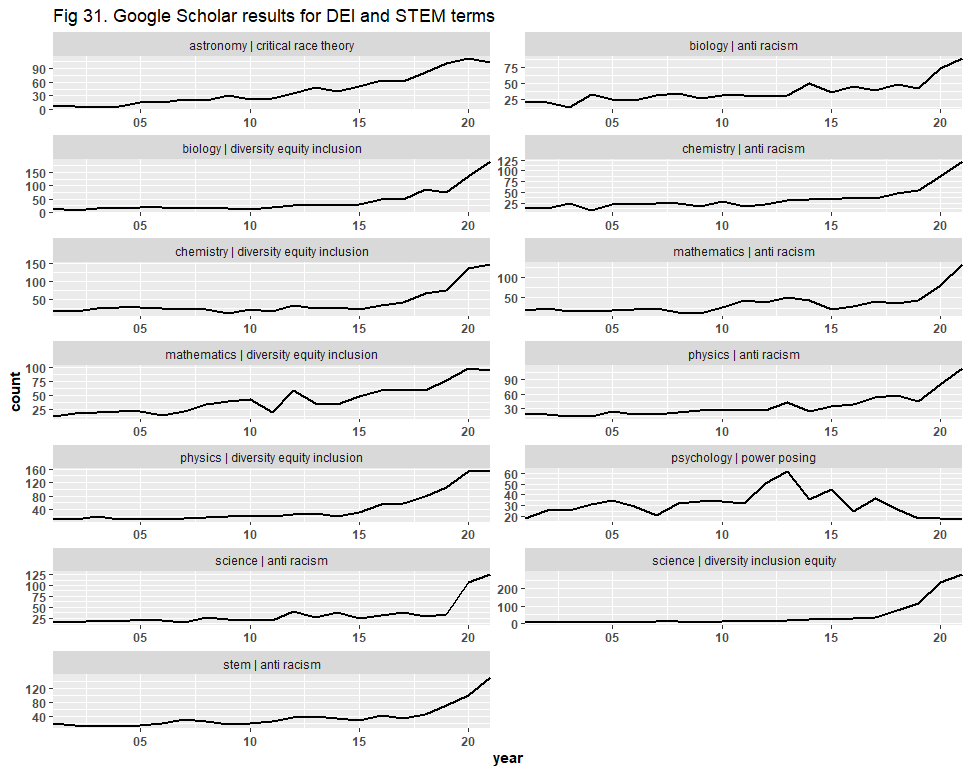
Then, we present the filtered results, where the trend lines remain mostly unaltered:
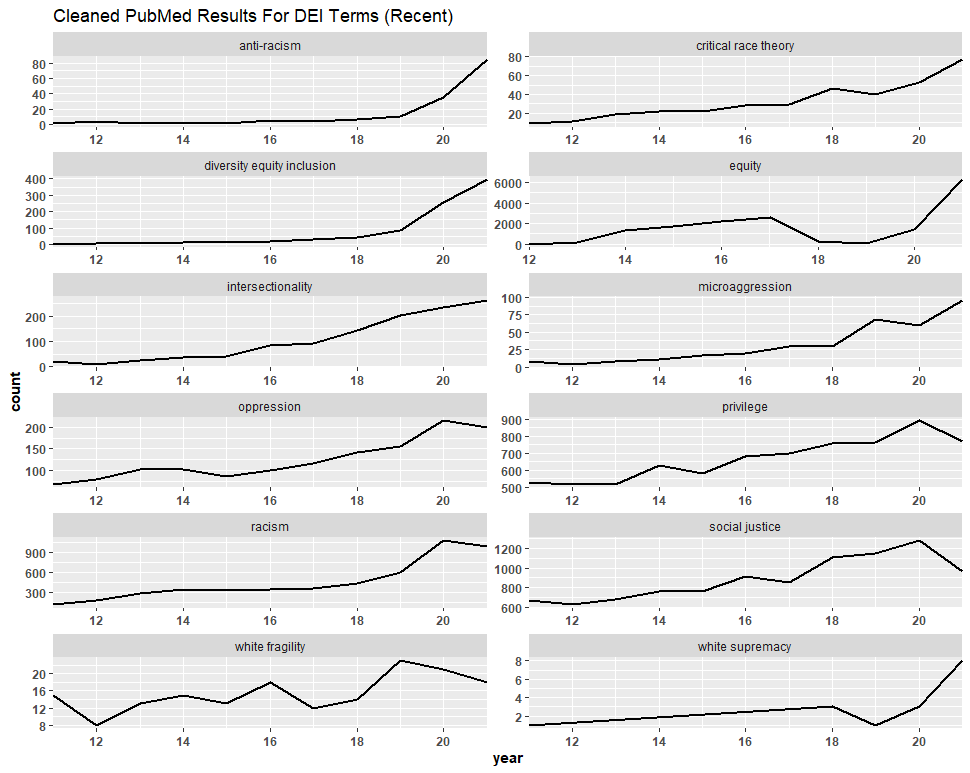
We followed a similar process with the PubMed dataset of 87,667 files. This time, however, we consolidated the duplicates, leaving us with 73,690 files. We then filtered the titles of the articles for anything not related to DEI, identifying 1,795 files, and removed them. This process left us with 71,895 files, meaning that we discarded about 18% of the dataset. We then created graphs comparing the trend lines of the original figures to the filtered figures. Again, we observed no significant difference, and in some cases—“anti-racism,” “diversity equity inclusion,” etc.—the graph was completely unaltered.
One should also note that, in addition to natural overlap from the separate searches, many of these duplicates appear to have been caused by the count of individual authors on co-authored articles. Like the NSF analysis, here we observe an increase not only in the absolute count of DEI-related articles but also in collaborations among authors.
Conclusions
While the y-axis / absolute counts may have shrunk considerably at times throughout this review, the trend lines we sought to visualize (upon which we based our conclusions) remain largely unaltered, and what changes did occur failed to refute any of our stated conclusions. In fact, our analyses revealed previously unreported trends: collaboration between scientists and authors on DEI-related projects and articles appears to have increased alongside the total number of projects and articles. This review has both reaffirmed and bolstered our conclusions that DEI ideology has intensified in the sciences.
For these reasons, we are not presently inclined to acquiesce to Dr. Bruna’s request that we retract our report. Still, we would like to thank Dr. Bruna for his comments, for the code he has provided, and for the fact that had he not drawn our attention back to the report, we may never have caught the error in the executive summary.
Dr. Bruna was also kind enough to compliment us on our transparency, describing our decision to release our data and code as “highly unusual.” Here, we agree, as transparency is, unfortunately, quite scarce. We hope that this article has resolved any confusion for our readers, and we welcome further scrutiny of our work.
(Additional graphs and the R code used for our analyses are available here in the file / updates).
Photo by hyesun on Adobe Stock