This Centiment/NAS poll, conducted from February 15-17, 2023, surveyed a representative sample of 1,020 registered voters in North Carolina with a margin of error of ± 3.1% (95% Confidence Interval). Respondents were asked whether they agreed or disagreed with several statements about the University of North Carolina and public higher education. Respondents were well represented across all major demographic categories of age, race, sex, education level, and voter registration. Summary statistics reporting average responses were weighted to reflect population level representation, although the impact of weights is minimal (less than the margin of error) because of the excellent demographic coverage of the sample.
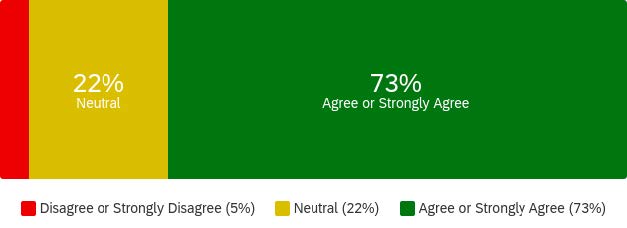
- UNC-Chapel Hill should promote freedom of thought and speech
| # | Field | Minimum | Maximum | Mean | Count |
|---|---|---|---|---|---|
| 1 | UNC-Chapel Hill should promote freedom of thought and speech | 1.0 | 3.0 | 2.7 | 1020 |
| # | Answer | Count | Weighted % | Weighted Count |
|---|---|---|---|---|
| 1 | Disgree or strongly disagree | 44 | 4.5% | 45.9 |
| 2 | Neutral | 201 | 22.2% | 226.4 |
| 3 | Agree or Strongly Agree | 775 | 73.3% | 747.7 |
| Total | 1020 | 100% | 1020.0 |
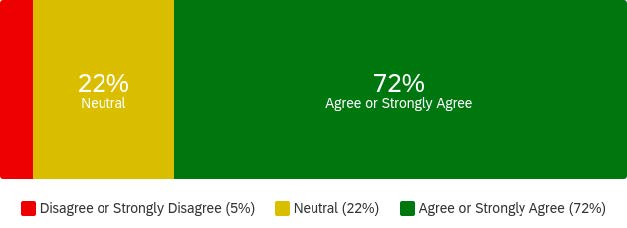
- Diversity of viewpoint is a very important form of diversity for all colleges and universities.
| # | Field | Minimum | Maximum | Mean | Count |
|---|---|---|---|---|---|
| 1 | Diversity of viewpoint is a very important form of diversity for all colleges and universities. | 1.0 | 3.0 | 2.7 | 1020 |
| # | Answer | Count | Weighted % | Weighted Count |
|---|---|---|---|---|
| 1 | Disagree or Strongly Disagree | 52 | 5.2% | 53.2 |
| 2 | Neutral | 210 | 22.4% | 228.6 |
| 3 | Agree or Strongly Agree | 758 | 72.4% | 738.1 |
| Total | 1020 | 100% | 1020.0 |
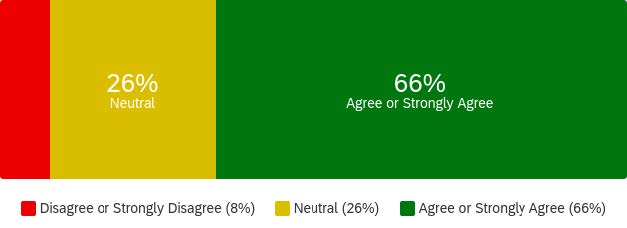
- UNC-Chapel Hill needs to do more to teach skills of respectful disagreement and dialogue necessary for citizenship.
| # | Field | Minimum | Maximum | Mean | Count |
|---|---|---|---|---|---|
| 1 | UNC-Chapel Hill needs to do more to teach skills of respectful disagreement and dialogue necessary for citizenship. | 1.0 | 3.0 | 2.6 | 1020 |
| # | Answer | Count | Weighted % | Weighted Count |
|---|---|---|---|---|
| 1 | Disagree or Strongly Disagree | 72 | 7.9% | 80.8 |
| 2 | Neutral | 260 | 26.4% | 269.5 |
| 3 | Agree or Strongly Disagree | 688 | 65.7% | 669.7 |
| Total | 1020 | 100% | 1020.0 |
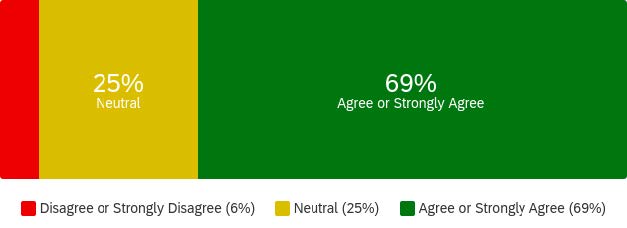
- UNC-Chapel Hill should do more to equip its graduates with the civic skills necessary for productive citizenship.
| # | Field | Minimum | Maximum | Mean | Count |
|---|---|---|---|---|---|
| 1 | UNC-Chapel Hill should do more to equitp its graduates with the civic skills necessary for productive citizenship | 1.0 | 3.0 | 2.6 | 1020 |
| # | Answer | Count | Weighted % | Weighted Count |
|---|---|---|---|---|
| 1 | Disagree or Strongly Disagree | 59 | 6.1% | 61.9 |
| 2 | Neutral | 225 | 25.4% | 259.1 |
| 3 | Agree or Strongly Disagree | 706 | 68.5% | 699.0 |
| Total | 1020 | 100% | 1020.0 |
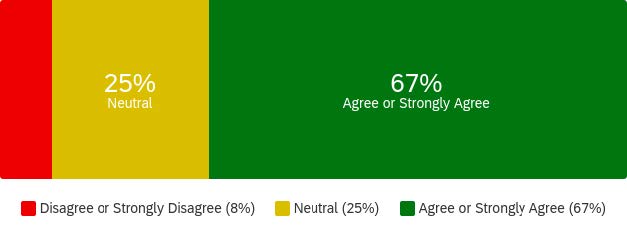
- I support the decision of the UNC-Chapel Hill trustees to create a new school at UNC to teach skills of civil discourse and respectful debate.
| # | Field | Minimum | Maximum | Mean | Count |
|---|---|---|---|---|---|
| 1 | I Support the decision of the UNC-Chapel Hill trustees to create a new school at UNC to teach skills of civil discourse and respectful debate | 1.0 | 3.0 | 2.6 | 1020 |
| # | Answer | Count | Weighted % | Weighted Count |
|---|---|---|---|---|
| 1 | Disagree or Strongly Disagree | 72 | 8.2% | 83.9 |
| 2 | Neutral | 248 | 25.1% | 255.6 |
| 3 | Agree or Strongly Disagree | 700 | 66.7% | 680.5 |
| Total | 1020 | 100% | 1020.0 |
- I support the UNC trustees’ plan to stop the university from asking their job applicants to state their political views.

| # | Field | Minimum | Maximum | Mean | Count |
|---|---|---|---|---|---|
| 1 | I support the UNC trustees' plan to stop the university from asking their job applicants to state their political views | 1.0 | 3.0 | 2.6 | 1020 |
| # | Answer | Count | Weighted % | Weighted Count |
|---|---|---|---|---|
| 1 | Disagree or Strongly Disagree | 76 | 8.1% | 82.4 |
| 2 | Neutral | 256 | 26.9% | 274.0 |
| 3 | Agree or Strongly Disagree | 688 | 65.1% | 663.6 |
| Total | 1020 | 100% | 1020.0 |
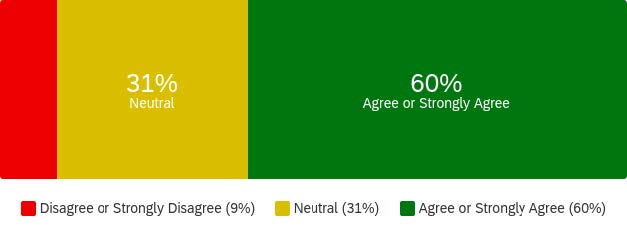
- North Carolina’s public universities should be led by officials who are accountable to the taxpayers through their elected representatives.
| # | Field | Minimum | Maximum | Mean | Count |
|---|---|---|---|---|---|
| 1 | North Carolina's public universities should be led by officals who are accountable to the taxpayers through their elected representatives | 1.0 | 3.0 | 2.5 | 1020 |
| # | Answer | Count | Weighted % | Weighted Count |
|---|---|---|---|---|
| 1 | Disagree or Strongly Disagree | 90 | 9.0% | 91.6 |
| 2 | Neutral | 296 | 30.5% | 311.4 |
| 3 | Agree or Strongly Disagree | 634 | 60.5% | 616.9 |
| Total | 1020 | 100% | 1020 |
- At taxpayer-funded universities, students deserve to hear both sides of important political questions.

| # | Field | Minimum | Maximum | Mean | Count |
|---|---|---|---|---|---|
| 1 | At taxpayer-funded universities, students deserve to hear both sides of important political questions | 1.0 | 3.0 | 2.7 | 1020 |
| # | Answer | Count | Weighted % | Weighted Count |
|---|---|---|---|---|
| 1 | Disagree or Strongly Disagree | 49 | 5.1% | 52.5 |
| 2 | Neutral | 195 | 20.2% | 206.0 |
| 3 | Agree or Strongly Disagree | 775 | 74.7% | 761.5 |
| Total | 1020 | 100 | 1020.0 |
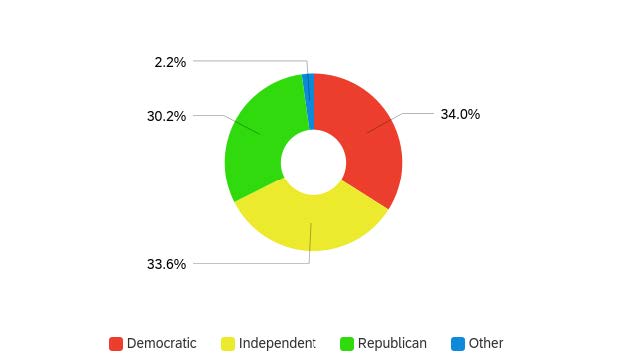
- What is your political affiliation?
| # | Field | Minimum | Maximum | Mean | Count |
|---|---|---|---|---|---|
| 1 | What is your political affiliation? | 1.0 | 4.0 | 2.0 | 1020 |
| # | Answer | Count | Weighted % | Weighed Count |
|---|---|---|---|---|
| 1 | Democratic | 341 | 34.0% | 346.5 |
| 2 | Independent | 236 | 33.6% | 342.6 |
| 3 | Republican | 333 | 30.2% | 308.4 |
| 4 | Other | 20 | 2.2% | 22.5 |
| Total | 1020 | 100% | 1020.0 |
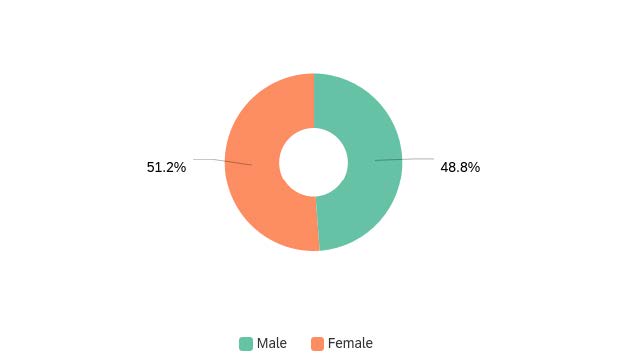
- Please select your gender:
| # | Field | Minimum | Maximum | Mean | Count |
|---|---|---|---|---|---|
| 1 | Please select your gender: | 1.0 | 2.0 | 1.5 | 1020 |
| # | Answer | Count | Weighted % | Weighted Count |
|---|---|---|---|---|
| 1 | Male | 411 | 48.8% | 497.8 |
| 2 | Female | 609 | 51.2% | 522.2 |
| Total | 1020 | 100 | 1020.0 |
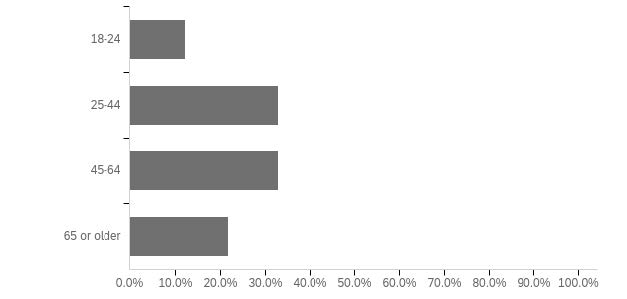
- What is your age?
| # | Field | Minimum | Maximum | Mean | Count |
|---|---|---|---|---|---|
| 1 | What is your age? | 1.0 | 4.0 | 2.6 | 1020 |
| # | Answer | Count | Weighted % | Weighted Count |
|---|---|---|---|---|
| 1 | 18-24 | 115 | 12.2% | 124.4 |
| 2 | 25-44 | 350 | 33.0% | 336.6 |
| 3 | 45-64 | 357 | 33.0% | 336.6 |
| 4 | 65 or older | 198 | 21.8% | 222.4 |
| Total | 1020 | 100% | 1020.0 |
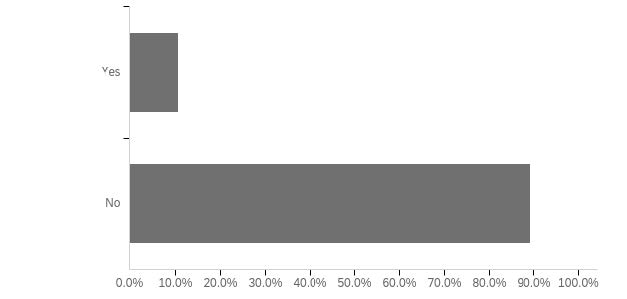
- Do you identify as Hispanic, Latino, or of Spanish origin?
| # | Field | Minimum | Maximum | Mean | Count |
|---|---|---|---|---|---|
| 1 | Do you identify as Hispanic, Latino, or of Spanish origin? | 1.0 | 2.0 | 1.9 | 1020 |
| # | Answer | Count | Weighted % | Weighted Count |
|---|---|---|---|---|
| 1 | Yes | 62 | 10.7% | 109.1 |
| 2 | No | 958 | 89.3% | 910.9 |
| Total | 1020 | 100% | 1020.0 |
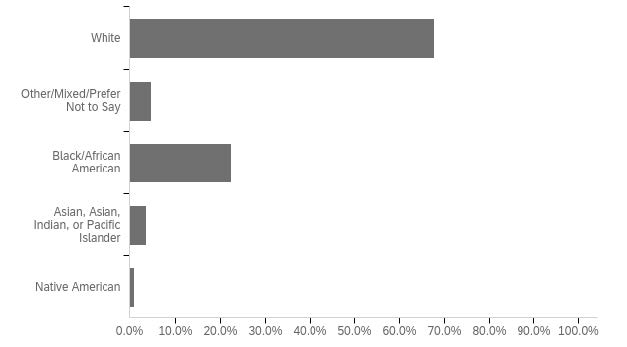
- Which of the following best describes your Race/Ethnicity?
| # | Field | Minimum | Maximum | Mean | Count |
|---|---|---|---|---|---|
| 1 | Which of the following best describes your Race/Ethnicity? | 1.0 | 5.0 | 1.7 | 1020 |
| # | Answer | Count | Weighted % | Weighted Count |
|---|---|---|---|---|
| 1 | White | 759 | 67.7% | 690.7 |
| 2 | Other/Mixed/Prefer Not to Say | 13 | 4.9% | 49.6 |
| 3 | Black/African American | 215 | 22.6% | 230.6 |
| 4 | Asian, Indian, or Pacific Islander | 29 | 3.7% | 38.0 |
| 5 | native American | 4 | 1.1% | 11.0 |
| Total | 1020 | 100% | 1020.0 |
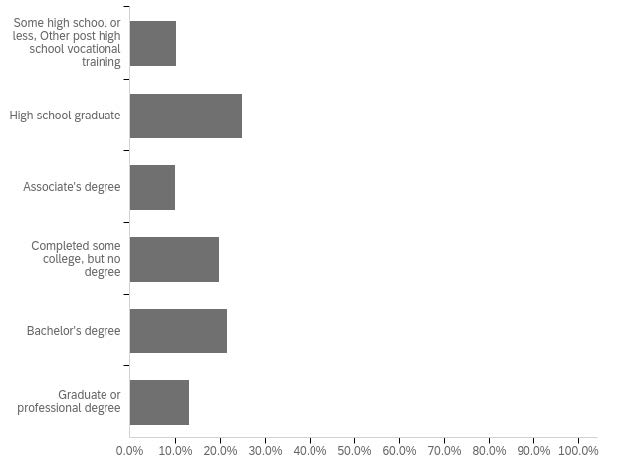
- What is the highest level of education you have completed?
| # | Field | Minimum | Maximum | Mean | Count |
|---|---|---|---|---|---|
| 1 | What is the highest level of education you have completed? | 1.0 | 6.0 | 3.6 | 1020 |
| # | Answer | Count | Weighted % | Weighted Count |
|---|---|---|---|---|
| 1 | Some high school or less, Other post high school vocational training | 64 | 10.3% | 105.1 |
| 2 | Neutral | 177 | 24.9% | 254.0 |
| 3 | Agree or Strongly Disagree | 155 | 10.1% | 103.0 |
| 4 | Completed some college, but no degree | 233 | 19.8% | 202.0 |
| 5 | Bachelor's degree | 275 | 21.7% | 221.3 |
| 6 | Graduate or professional degree | 116 | 13.2% | 134.6 |
| Total | 1020 | 100% | 1020.0 |
Read the PDF:
Photo by Gene Gallin on Unsplash