Will Rogers once famously quipped that everyone talked about the weather, but nobody ever did anything about it. Here’s a paraphrase: everyone talks about diversity, inclusion, and equity. But what’s paying for it?
Aside from its undermining of the traditional values of academia, Diversity, Inclusion, and Equity™ is a very expensive enterprise. The money to pay for it has to come from somewhere. As I’ve argued elsewhere, it is the sciences, specifically the enormous stream of federal revenues that fund science, that have been surreptitiously footing the bill for many years now.
Which brings me to this article, from the Chronicle of Higher Education, describing the aspirations of ten Historically Black Colleges and Universities (HBCU) to change their Carnegie Foundation ranking from R2 to R1. You have no idea what I’m talking about? No wonder: this is inside baseball. But more is at stake, so some explanation is in order.
Since 1970, the Carnegie Classification of Institutions of Higher Education has been classifying colleges into groups so that fair comparisons can be made between them. Nobody would pit an NBA team against a high school basketball team and call that a fair comparison. The Carnegie classifications are meant to ensure that type of mismatch doesn’t happen when comparing colleges and universities with one another.
There are more than thirty Carnegie classifications. R1 designates doctoral universities with “very high” research activity. R2 is for doctoral universities with “high” research activity. Presently, there are no HBCUs that are classified R1, although there are several that are classified R2. The article helpfully lists ten of them, describes their aspirations to rise to R1, and outlines the obstacles they face to realizing those hopes.
Granting the very real inequities these colleges have faced, one must ask: is being designated R2 one of them? Having spent my academic career at an R2 institution, and never having felt it was a mark of inferiority, I thought to look into it more deeply.
It’s always enlightening to follow the money, so I did, with the aid of the National Science Foundation’s (NSF) publicly available grant databases. I compiled the ten-year records of research grants and funding for the HBCUs listed in the article, and I compared them to a similar sample of R2 universities not designated as HBCU (full disclosure: my former university was one of them) and to ten R1 universities.
Here is my list:
| HBCU R2 institutions | Non-HBCU R2 institutions | R1 institutions |
|---|---|---|
| Clark Atlanta University | Brigham Young University | Auburn University |
| Florida Agricultural and Mechanical University | California State University Fresno | California Polytechnic |
| Howard University | Cleveland State University | Cornell University |
| Jackson State University | Florida Atlantic University | Dartmouth University |
| Morgan State University | Idaho State University | Florida State University |
| North Carolina Agricultural & Technical State University | Northern Illinois University | Indiana University |
| Prairie View A & M University | Rochester Institute of Technology | Louisiana State University |
| Southern University | SUNY Environmental Science and Forestry | Montana State University |
| Tennessee State University | The New School | University of Cincinnati |
| University of Maryland Eastern Shore | University of Akron | University of North Texas |
Here are the numbers of grants, and awards over the past decade for the three types of institutions:
| Carnegie class | Number of NSF grants | NSF awards |
|---|---|---|
| HBCU R2 | 778 | $398,194,341 |
| Non-HBCU R2 | 1275 | $438,543,758 |
| R1 | 5183 | $2,897,221,567 |
There are two notable things.
First, the HBCU R2 universities fall below the non-HBCU R2 universities by about 10%. Compared to the sample R1 universities, however, this difference is minuscule: the R1 universities had nearly seven times the research grants awarded and drew in more than seven times the research revenues.
The numbers indicate how high the hurdle is for an R2 institution to achieve R1. It is not just a matter of research grants. Climbing to an R1 classification would require a major expansion of infrastructure, administrative staff, and research faculty. Could the HBCU institutions pull it off? Perhaps, with a massive infusion of funding. Even if they could, though, could it be done without irrevocably changing the unique academic culture that attracts students to them? And why have the ambition in the first place? Among the R2 institutions sampled, the HBCU institutions actually do not fare badly: eight of the HBCU universities in the list actually rank higher in both numbers of grants and awards than did my own non-HBCU institution. Even classified as R2, my college built a solid reputation for the quality of its research program. There’s nothing inherently blocking HBCUs from building solid research programs: Howard University and North Carolina A&T stand out as successful examples.
The second notable thing requires a deeper dive into the NSF data. A bit more arcana is needed to make sense of this. The NSF is organized into eight directorates, which fund eight different categories of research programs. There’s a directorate for biology distinct from the directorate for, say, chemistry. There are also directorates for the “softer” sciences. By identifying the directorate that is funding the research grants for an institution, we can learn something about that institution’s “scientific culture.” If the bulk of funding comes from the Biological Sciences directorate, that institution can be marked as strong on biology. The same logic applies for the Mathematics and Physical Sciences directorate, and so forth.
Figures 1-3 break out patterns of funding from the NSF directorates for the three categories of colleges: HBCU R2, non-HBCU R2, and R1. Figure 1 is the number of grants awarded, again over the past decade, Figure 2 is the award amounts over the same period, and Figure 3 is the percentage of total grants awarded.
The most obvious pattern is the large disparity between the R2 institutions and the R1 institutions. No surprise there: “very high” research output will be greater compared to “high” research activity. More surprising is the pattern of funding, notably from the directorate for Education and Human Resources (EHR; leftmost columns).
The HBCU colleges received more grants (339) from the EHR directorate compared to the non-HBCU colleges (160), and even compared to the R1 colleges (311; Figure 1). The HBCU universities drew in about $239 million from the EHR directorate, slightly less compared to the $255 million take for the R1 universities, but far more compared to the roughly $90 million brought in by the non-HBCU R2 universities (Figure 2). So the HBCU colleges are doing pretty well at pulling down funding from the EHR directorate.
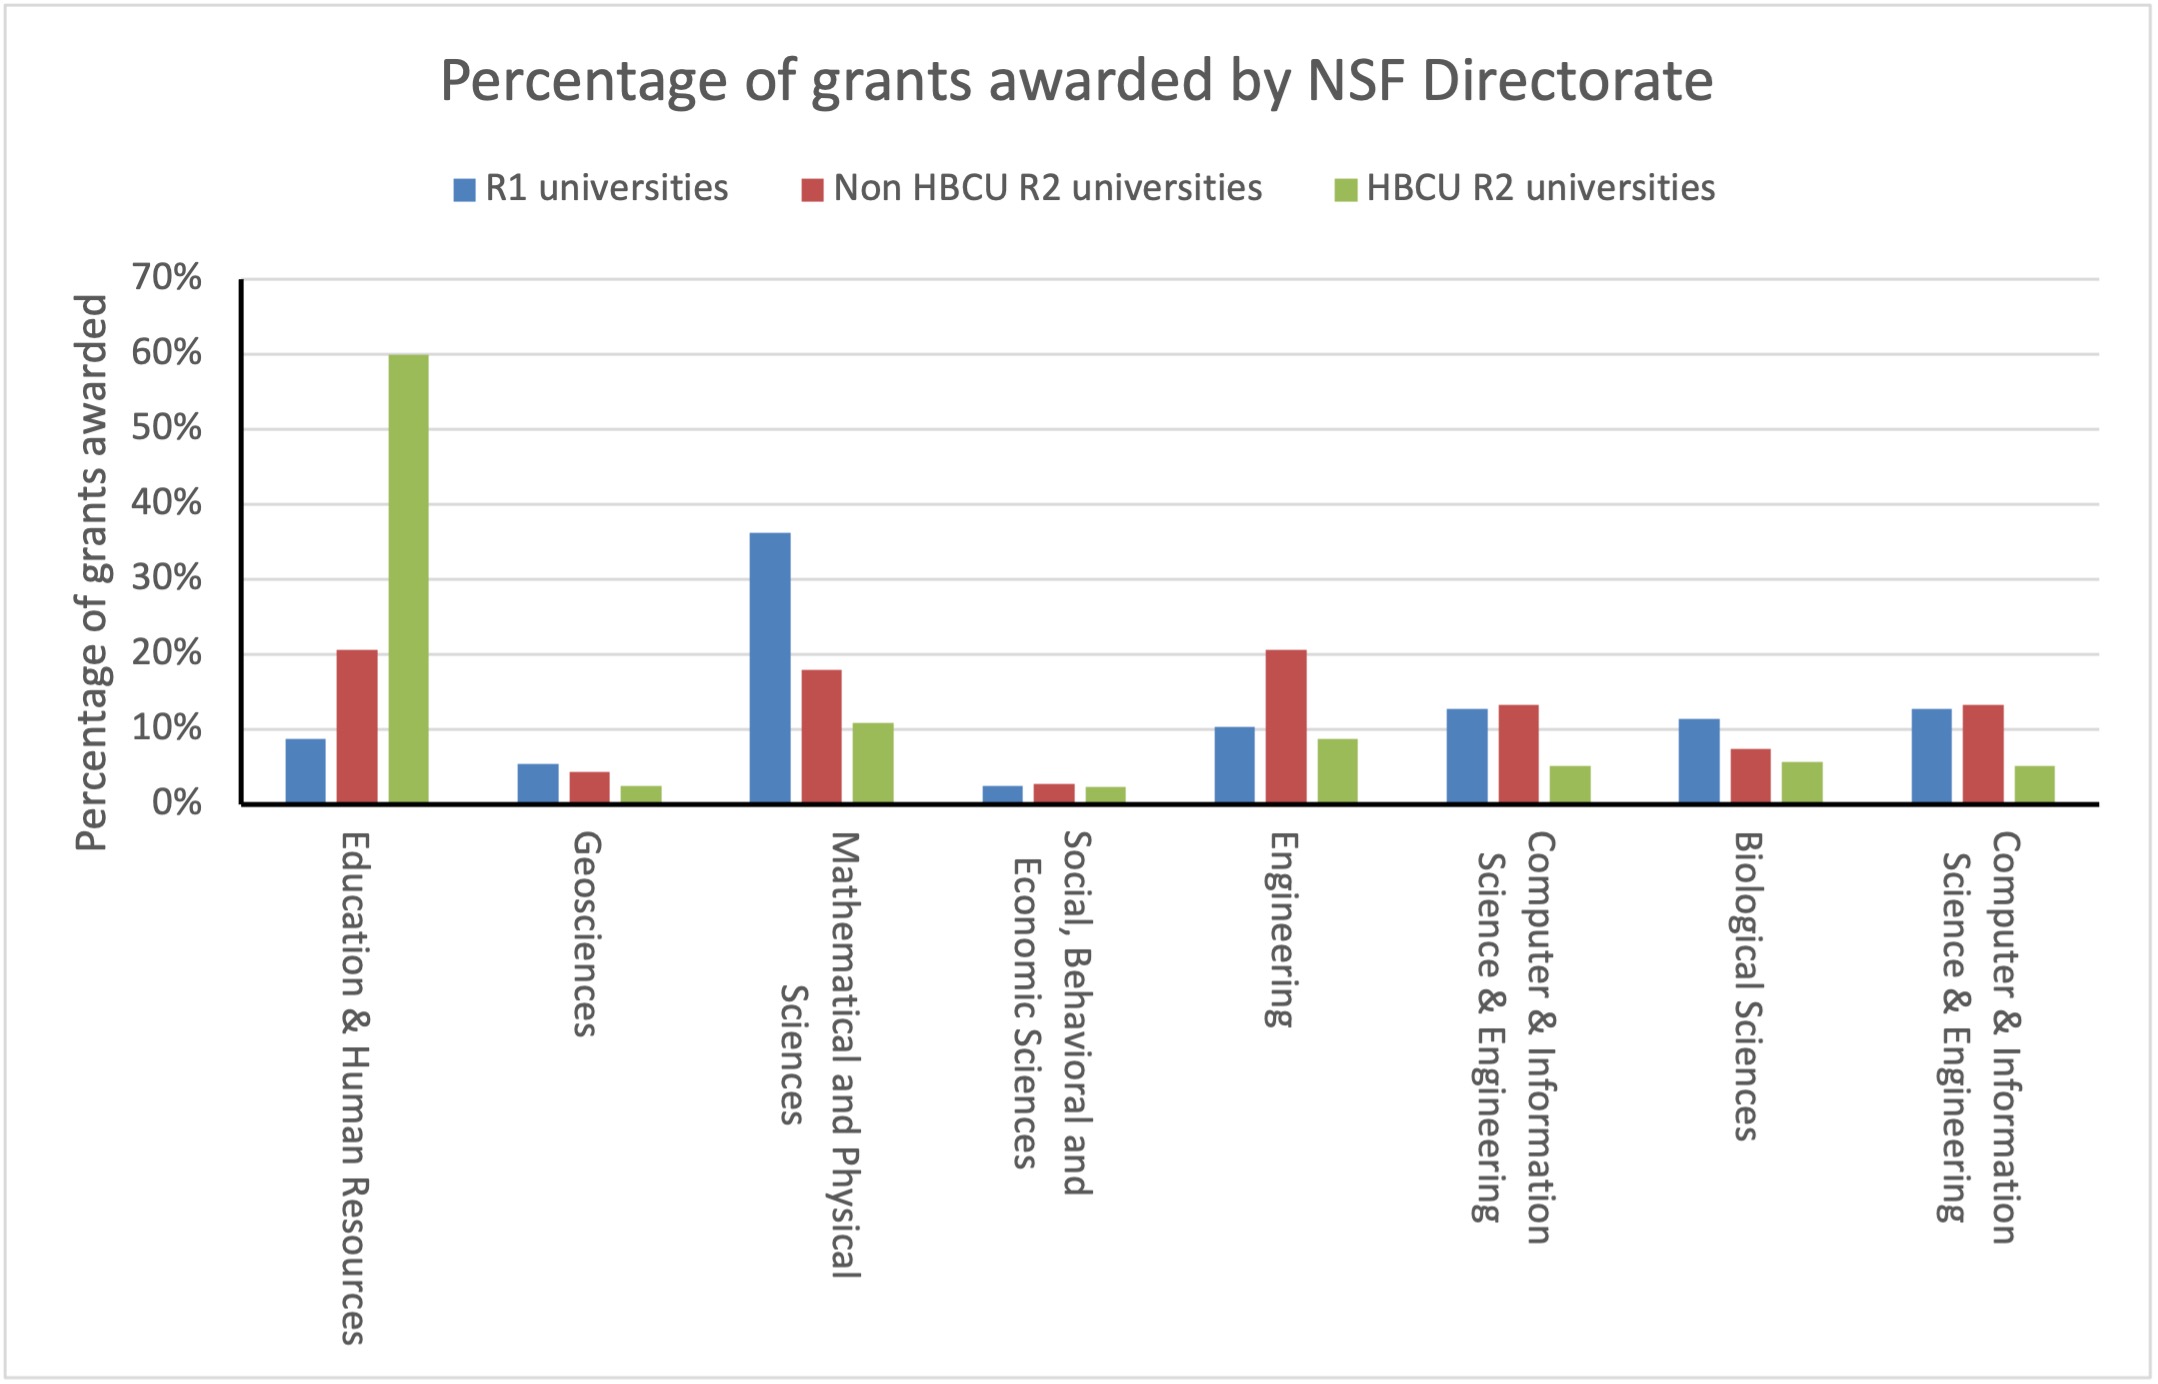
The distribution of awards among the directorates (Figure 3) reveals the most interesting pattern. For the R1 and non-HBCU R2 universities, grants were roughly evenly distributed among the NSF directorates (Physics and Mathematics excepted, reflecting that Physics is a very expensive science). In comparison, the distribution of grants for the HBCU colleges is strongly skewed toward funding from the EHR directorate: of the grants awarded to the HBCU colleges, more than 60% came from the EHR directorate (Figure 3). The remaining 40% is distributed among the other seven directorates.
We can draw three lessons from these patterns.
First, the differences reflect the obvious fact that different institutions are, in fact, different. The HBCU colleges are clearly geared toward education and uplift, which aligns them with the goals of the Education and Human Resources directorate. The HBCU colleges are growing enterprises because their clientele wants what they have to offer: education and uplift.
Second, the striving of a college to attain R1 status is often misguided. Where it has been tried, the outcome is generally homogenization: every R1-aspiring college tends to become like every other R1-aspiring college. The HBCUs are a unique class of institution, for good reason, and the aspiration to R1 will likely undercut that.
Third, we gain some insight into how the very expensive rise of DIE ideology is being funded. The NSF grants database can be searched for keywords. The table below lists the number of mentions of three common DIE keywords in the title and abstract of the grants supported by the EHR directorate. There is a rough correlation between grants coming from the EHR directorate and grants aiming toward DIE goals.
| Keyword | HBCU R2 ($239 million) | Non-HBCU R2 ($90 million) | R1 ($254 million) |
|---|---|---|---|
| underrepresent | 291 | 239 | 816 |
| STEM | 463 | 349 | 915 |
| minority | 262 | 91 | 275 |
Keep in mind that these figures are for a sample of ten universities, which is only the tip of the iceberg. Over ten years, the EHR directorate has issued 8,133 grants that mention STEM in their titles and abstracts. Of those grants, 2,150 of them were awards of a million dollars or more. Over all directorates, a total of 2,839 grants were awards of more than a million dollars. Obviously, there is a great deal of research funding available for DIE initiatives in the sciences—in the tens of billions of dollars—and universities eager to tap into that enormous revenue stream.
Are you wondering why the toxic ideology of DIE is taking over the sciences? Just follow the money.
| NSF Directorate | Number of grants over ten years (keyword=STEM) |
|---|---|
| NSF Director | 358 |
| Mathematical and Physical Sciences | 3,060 |
| Social, Behavioral and Economic Sciences | 954 |
| Computer & Information Science & Engineering | 1,626 |
| Geosciences | 1,846 |
| Engineering | 3,591 |
| Biological Sciences | 1,972 |
| Education and Human Resources | 8,133 |
Figure 1. Numbers of grants awarded over ten years by the NSF directorates.
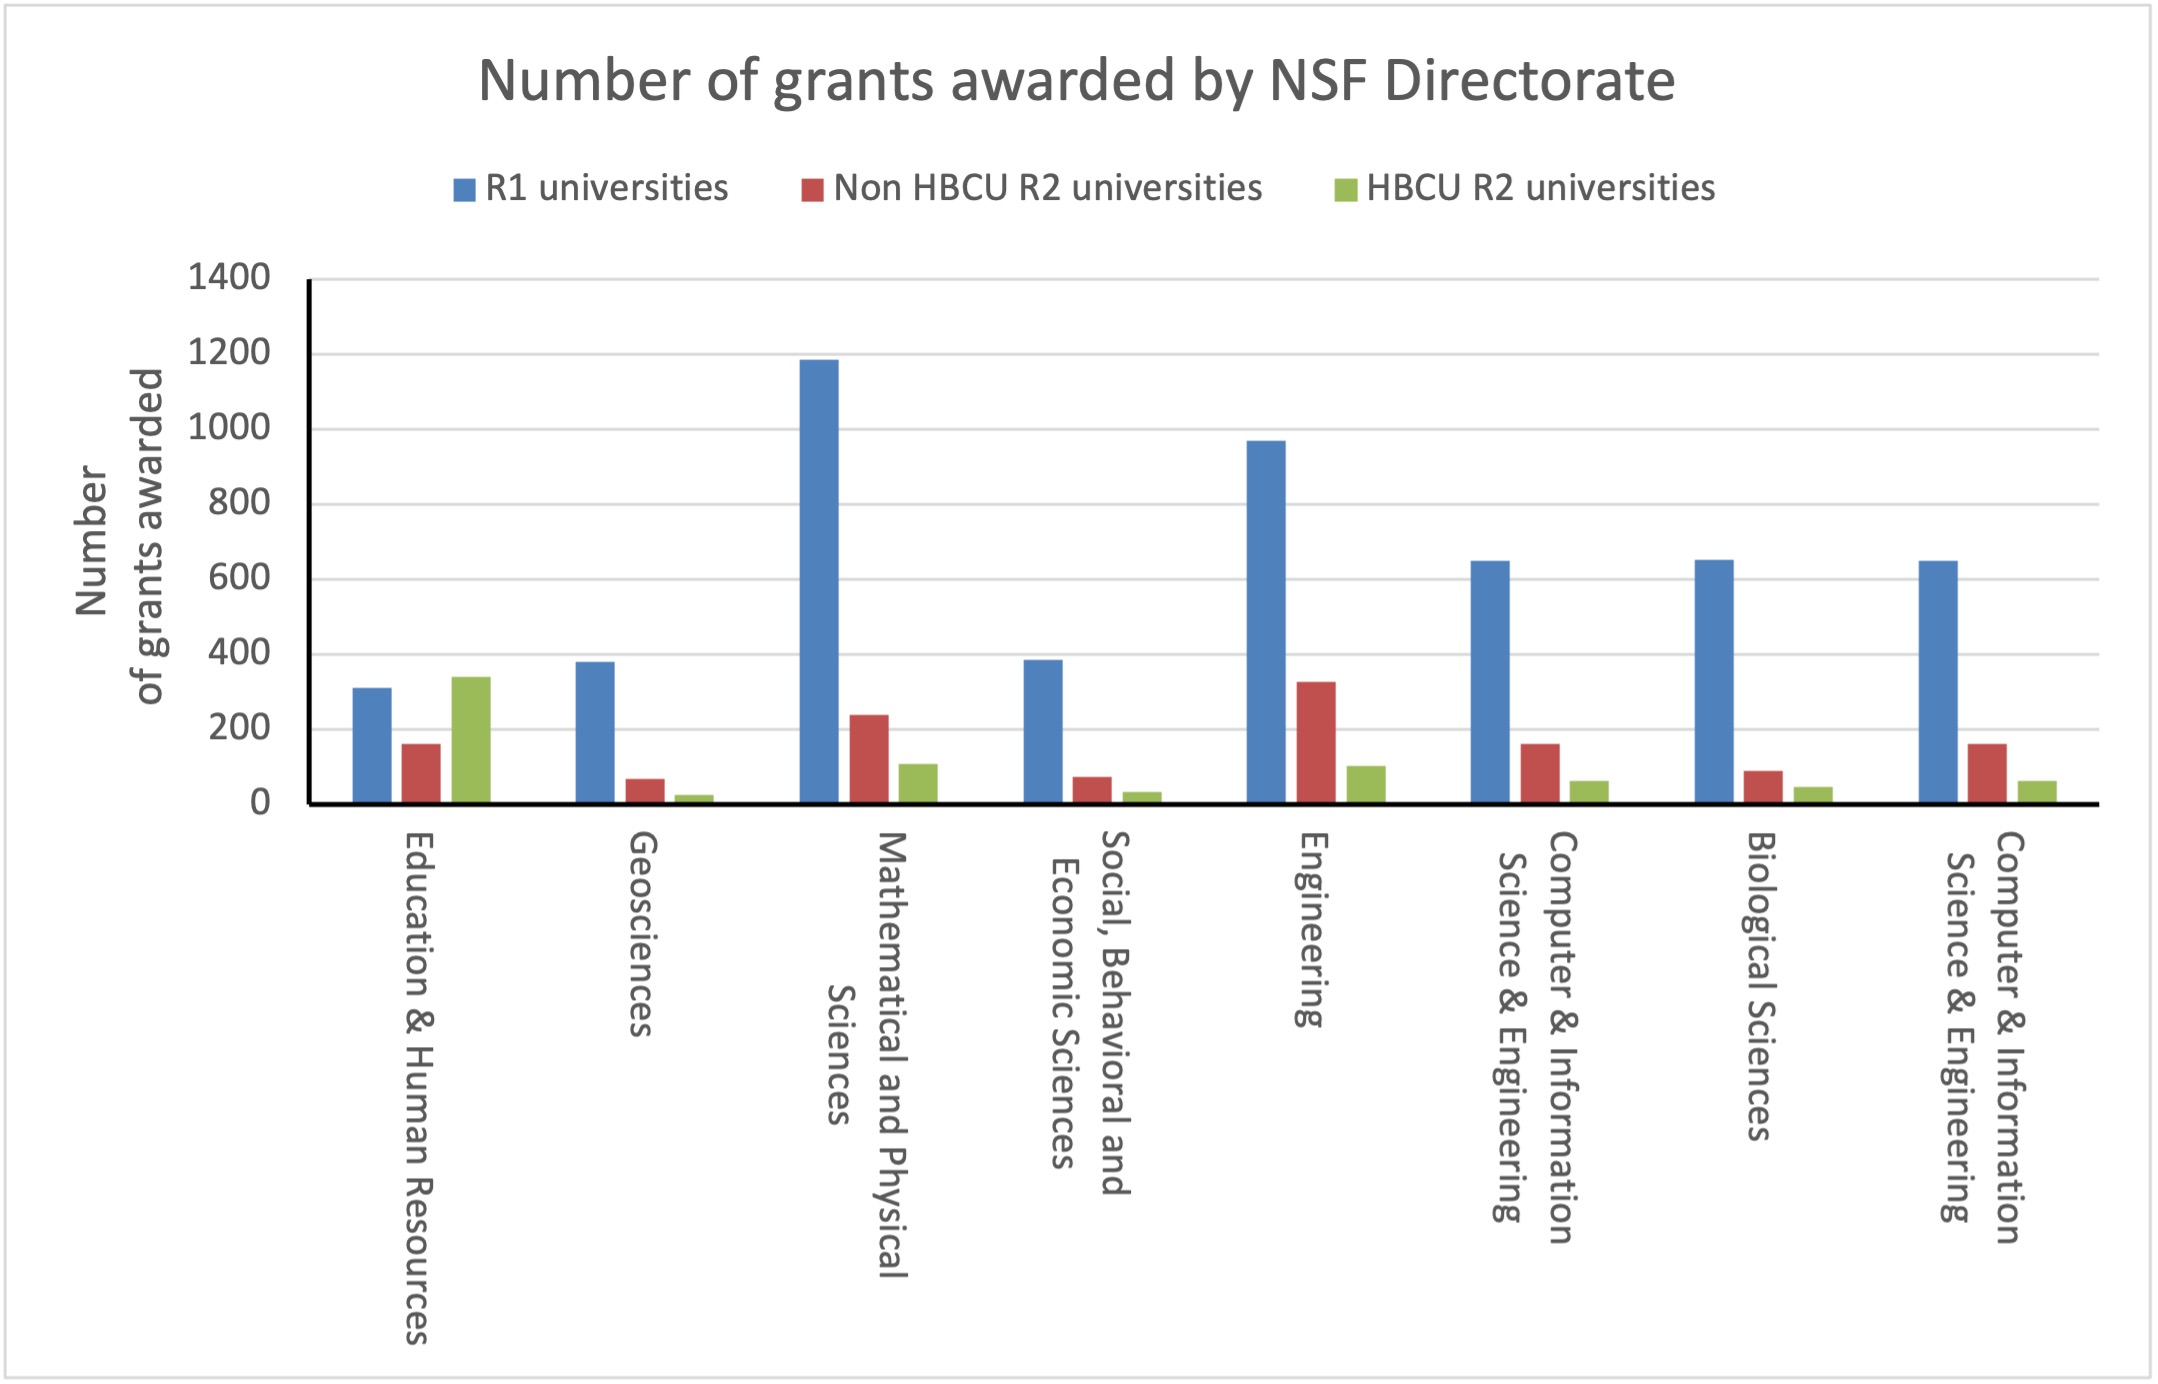
Figure 2. Awards granted over ten years by the NSF directorates.
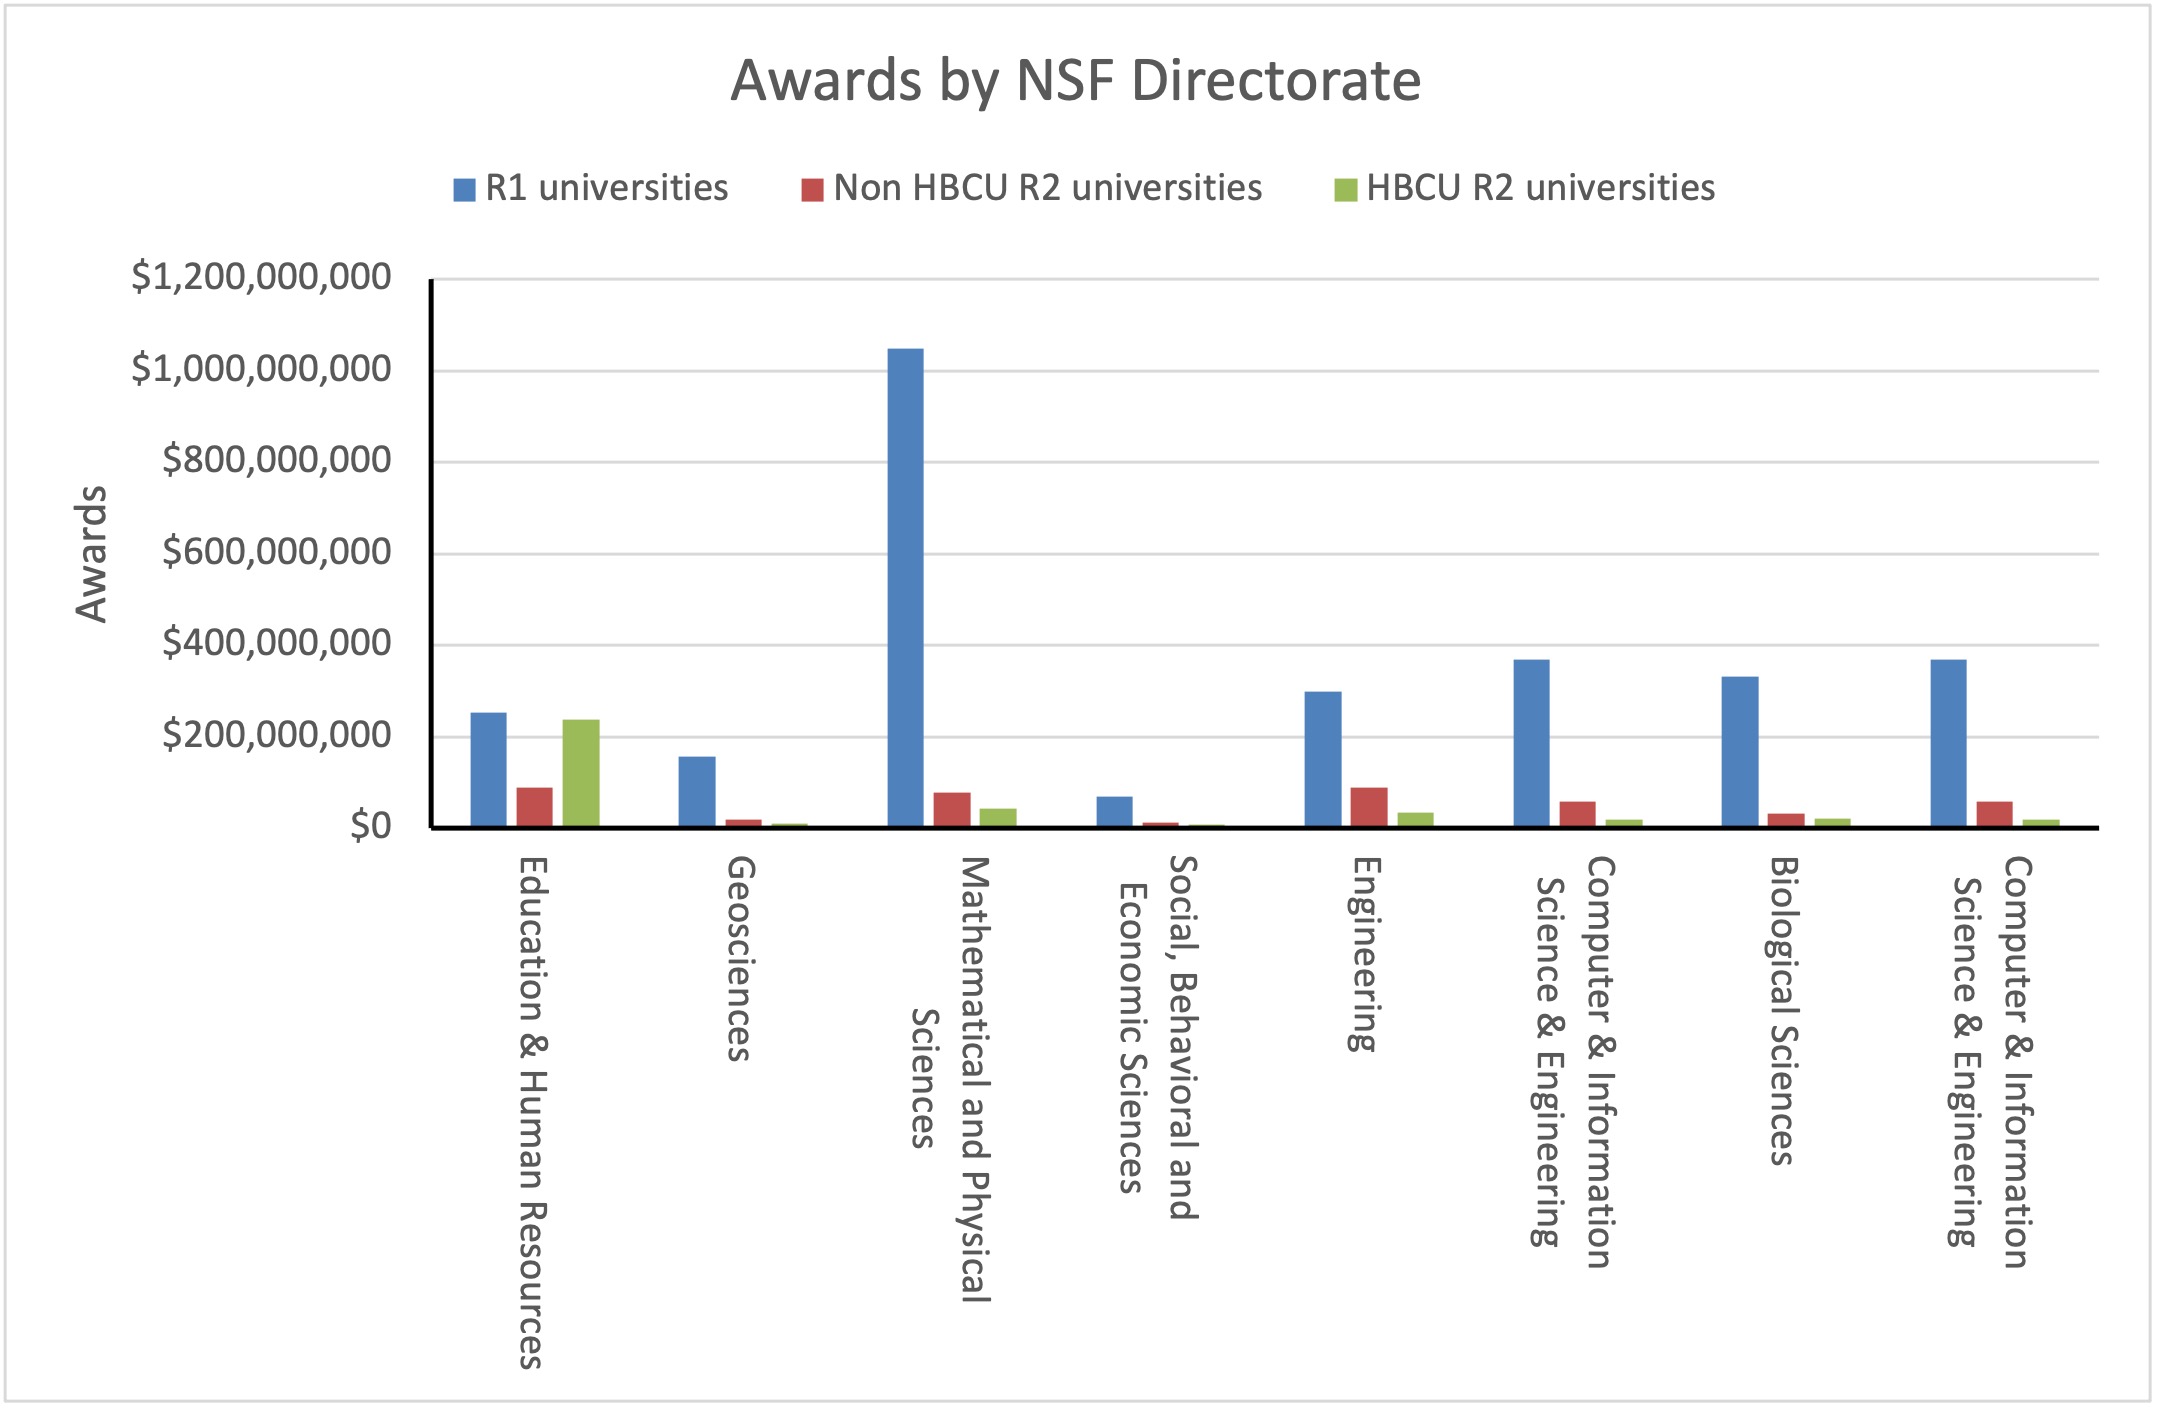
Figure 3. Percent of total grants awarded over ten years by the NSF directorates.
Dr. J. Scott Turner is Director of the Diversity in the Sciences Project for the National Association of Scholars.
Image: qimono, Public Domain